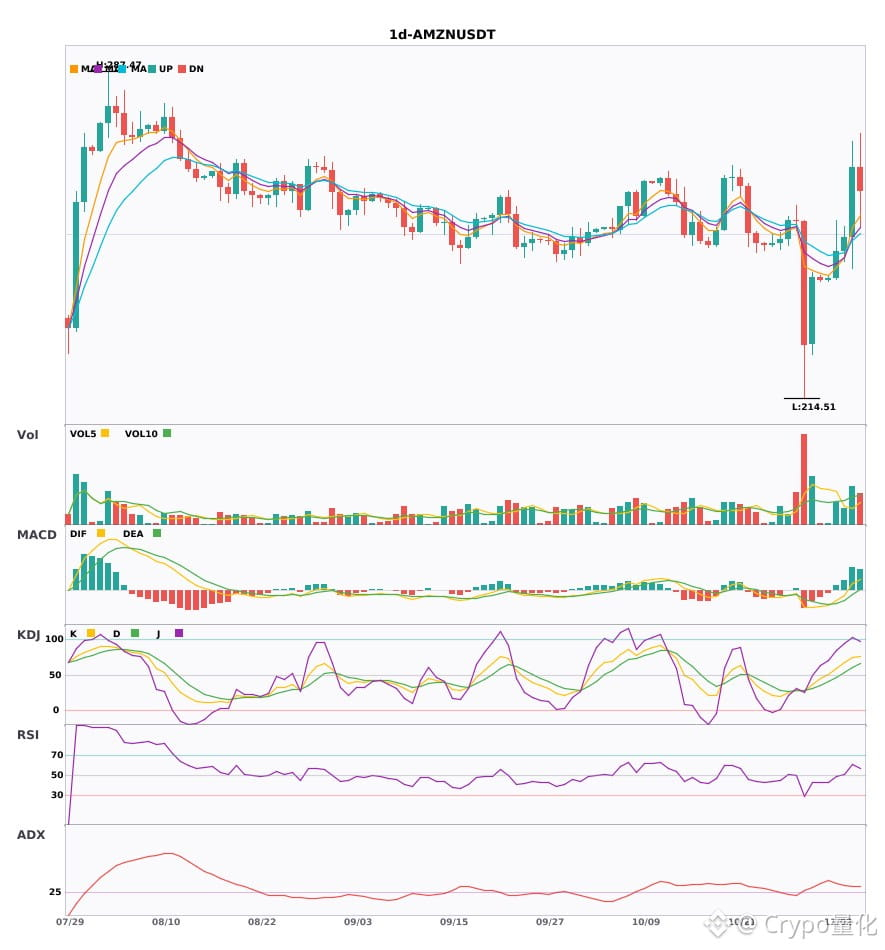
$AMZN daily chart is bullish; key indicators confirm 🔥
════════════════════
🔴 $AMZN daily chart bullish signal
⚠️ Technical analysis: ADX(34) indicates a clear trending market | MACD DIF breaks above the zero line, signaling a bullish trend reversal | EMA5 > EMA8 > EMA13, bullish alignment | KDJ is running strong, with bulls in control (K: 74.7, D: 60.6) | Volume is normal (1.4x)
════════════════════
🔔 Follow for first-hand market updates 🔔
#技术分析 #AMZN
📌 When trading, pay attention to whether the candlestick patterns are consistent
════════════════════
🔴 $AMZN daily chart bullish signal
⚠️ Technical analysis: ADX(34) indicates a clear trending market | MACD DIF breaks above the zero line, signaling a bullish trend reversal | EMA5 > EMA8 > EMA13, bullish alignment | KDJ is running strong, with bulls in control (K: 74.7, D: 60.6) | Volume is normal (1.4x)
════════════════════
🔔 Follow for first-hand market updates 🔔
#技术分析 #AMZN
📌 When trading, pay attention to whether the candlestick patterns are consistent