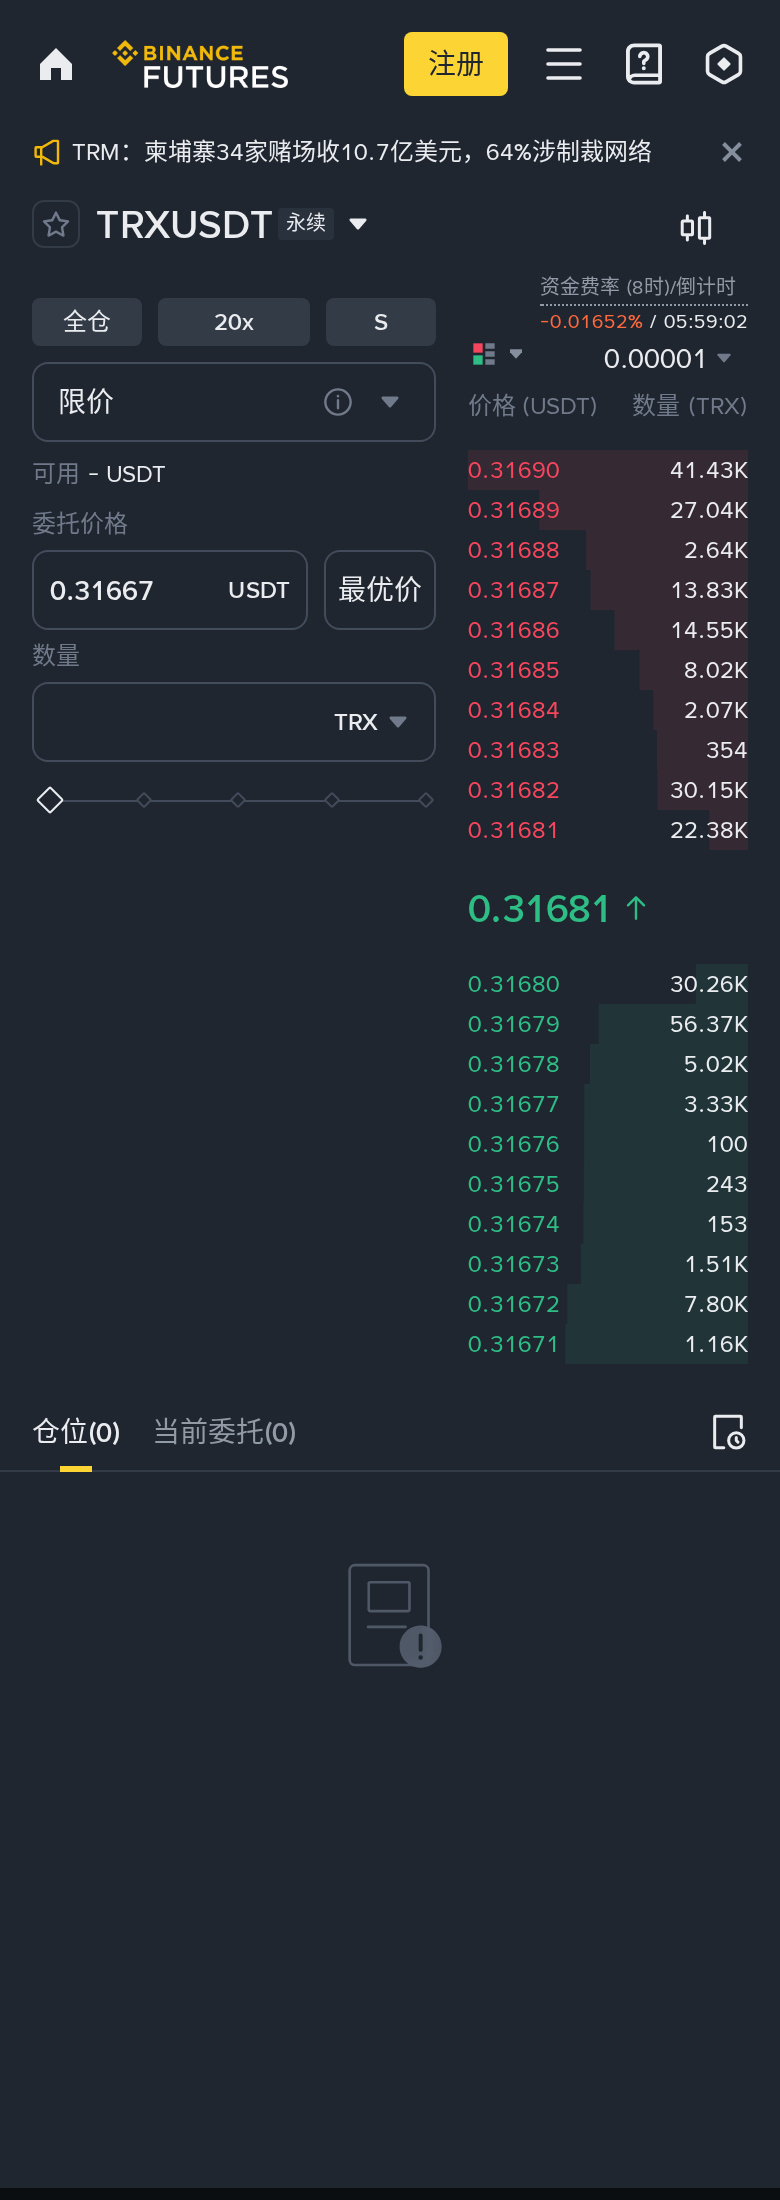
I've been watching TRX for days, and today it finally gave us an opportunity
【Short】Current price 0.317100, with entry and exit clearly laid out
Straight to the point: short immediately at the current price of 0.317100, stop loss at 0.325311. If it moves above that, admit you're wrong.
· 0.3156 below is support, where buyers may step in; 0.3206 above is resistance, where selling pressure may emerge
How to trade (short):
· Entry: Short immediately at the current price of 0.317080
· Stop: 0.325311 (accept a 2.6% loss; don't hold on stubbornly)
· Target: 0.292386 (first target; take half off when it gets there)
· Position: Start by testing with 1–2% of your capital; don't go all in
(Win rate is based on historical data and isn't guaranteed; if you copy the trade, always use a stop loss and control your position size)
1、$TRX Current price 0.3171, with MACD still held below the zero line. Short the rebound at 0.3171, stop loss at 0.3253, with 0.3015 as the downside target. RSI is 36, and even the rebound lacks strength.
24h trading volume is 6.4M, and volume is still there, which means the money hasn't left.
When it reaches 0.3015, take half off first, then decide whether to hold the rest.
For those watching the charts, remember: until it gets back above 0.3015, treat every rise as a rebound.
If it breaks straight through 0.3156, that means the short was right—but remember to move your stop loss close to your entry price. Don't let a winning trade turn into a losing one.
The 20-day moving average at 0.3184 is already hanging overhead. If the rebound can't get past it, the bears are in control.
The short-term range is very clear: support at 0.3156, resistance at 0.3206. For a short trade, use resistance as your line of defense.
Let's do the math: the downside to support at 0.3156 is 0.5%, while the upside to resistance at 0.3206 is 1.1%. There's not enough room here to cover the risk, so don't enter here.
If it breaks below 0.3156, don't rush to exit; there's another level below at 0.3123.
Feel free to disagree—I don't bite.
#TRX #TRON
【Live Market Scan · $TRX 】(1-hour primary trend + 4H filter)
4H trend: Strongly bearish|1-hour pattern: Not formed yet (keep waiting)
Long/short score: 9 points (Bearish alignment +3 | MACD favors shorts +1 | Below zero line +1 | RSI stabilizing +1 | Near EMA20 +1 | Top reversal +2)
Current price 0.3171 RSI 35.52 Support 0.3156 / Resistance 0.3206
Conclusion: Bearish score is higher (pattern not fully confirmed) → Maintain a bearish bias; recommend waiting for a rebound to resistance before shorting
$TRX
【Short】Current price 0.317100, with entry and exit clearly laid out
Straight to the point: short immediately at the current price of 0.317100, stop loss at 0.325311. If it moves above that, admit you're wrong.
· 0.3156 below is support, where buyers may step in; 0.3206 above is resistance, where selling pressure may emerge
How to trade (short):
· Entry: Short immediately at the current price of 0.317080
· Stop: 0.325311 (accept a 2.6% loss; don't hold on stubbornly)
· Target: 0.292386 (first target; take half off when it gets there)
· Position: Start by testing with 1–2% of your capital; don't go all in
(Win rate is based on historical data and isn't guaranteed; if you copy the trade, always use a stop loss and control your position size)
1、$TRX Current price 0.3171, with MACD still held below the zero line. Short the rebound at 0.3171, stop loss at 0.3253, with 0.3015 as the downside target. RSI is 36, and even the rebound lacks strength.
24h trading volume is 6.4M, and volume is still there, which means the money hasn't left.
When it reaches 0.3015, take half off first, then decide whether to hold the rest.
For those watching the charts, remember: until it gets back above 0.3015, treat every rise as a rebound.
If it breaks straight through 0.3156, that means the short was right—but remember to move your stop loss close to your entry price. Don't let a winning trade turn into a losing one.
The 20-day moving average at 0.3184 is already hanging overhead. If the rebound can't get past it, the bears are in control.
The short-term range is very clear: support at 0.3156, resistance at 0.3206. For a short trade, use resistance as your line of defense.
Let's do the math: the downside to support at 0.3156 is 0.5%, while the upside to resistance at 0.3206 is 1.1%. There's not enough room here to cover the risk, so don't enter here.
If it breaks below 0.3156, don't rush to exit; there's another level below at 0.3123.
Feel free to disagree—I don't bite.
#TRX #TRON
【Live Market Scan · $TRX 】(1-hour primary trend + 4H filter)
4H trend: Strongly bearish|1-hour pattern: Not formed yet (keep waiting)
Long/short score: 9 points (Bearish alignment +3 | MACD favors shorts +1 | Below zero line +1 | RSI stabilizing +1 | Near EMA20 +1 | Top reversal +2)
Current price 0.3171 RSI 35.52 Support 0.3156 / Resistance 0.3206
Conclusion: Bearish score is higher (pattern not fully confirmed) → Maintain a bearish bias; recommend waiting for a rebound to resistance before shorting
$TRX