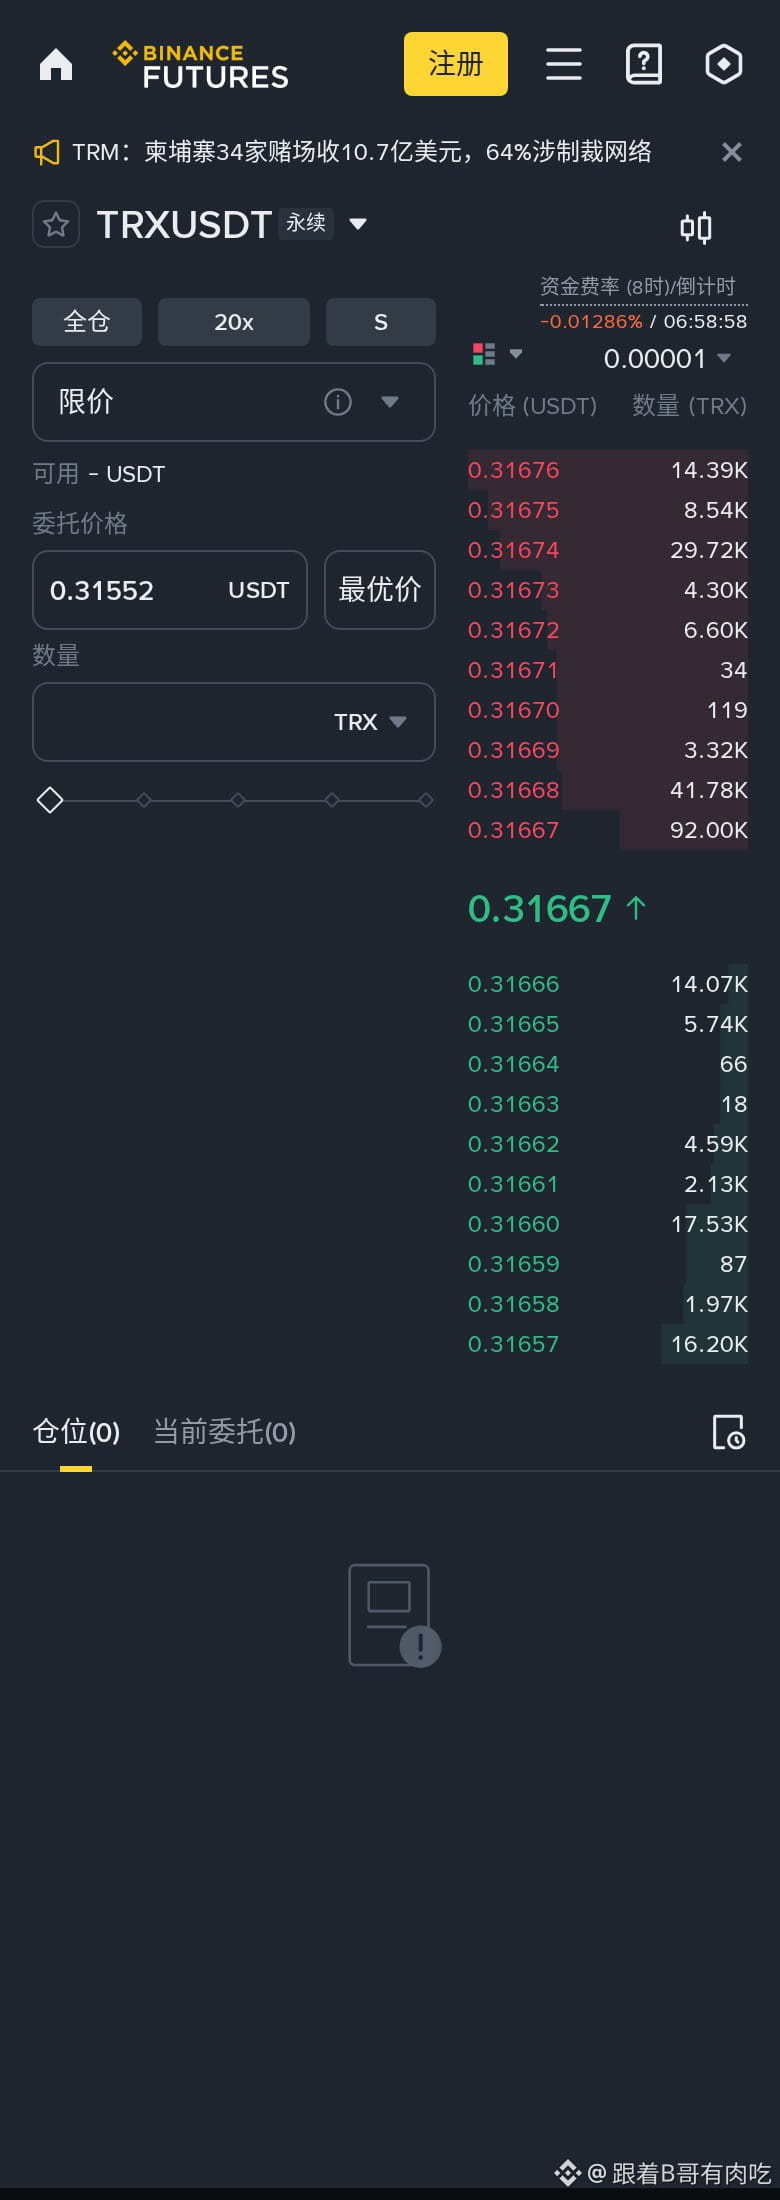
TRX is at a crossroads again
[SHORT] Current price 0.316900—which way it goes is written on the chart
Here's the conclusion first: short at the current price of 0.316900, with a stop-loss at 0.323259. If it moves above that, admit you're wrong.
· 0.3156 below is support, where buyers may step in; 0.3206 above is resistance, where selling is likely
How to trade (short):
· Entry: Short immediately at the current price of 0.316880
· Stop: 0.323259 (accept a 2.0% loss; don't hold on)
· Target: 0.297742 (first target; take half off when it gets there)
· Position: Start with 1–2% of your funds to test the trade; don't go all in
(Win rates are based on historical statistics and aren't guaranteed; if you copy this trade, always use a stop-loss and manage your position size.)
At $TRX , I'm leaning bearish. The MACD has crossed down, and I'm looking for 0.3067 within this month, at least a 3.2% pullback. RSI is 33, and even a bounce would lack strength. The short-term range is clear: support at 0.3156, resistance at 0.3206. Use resistance as your line in the sand for a short. At 0.3067, take half off; then see whether the rest can drop to 0.2883.
If it breaks straight through 0.3156, that means the short was right. But remember to move your stop-loss near your entry price—don't let a winning trade turn into a losing one.
Trading volume is 6.3M, enough to support a move.
The 20-day moving average at 0.3185 is already overhead. If the rebound can't get above it, the bears are in control.
I personally opened a short at the current price of 0.3169, with a stop-loss at 0.3233, using a small position to test the trade.
Let's do the math: a move down to support at 0.3156 is 0.4%, while a move up to resistance at 0.3206 is 1.2%. There's not enough room here to cover the risk, so don't enter at this level.
If 0.3156 also fails to hold, the next downside area to watch is around 0.3123.
Comment 1 if you agree.
#TRX #波场 #Crypto
[Live Market Scan · $TRX ] (1-hour primary setup + 4H filter)
4H trend: Strongly bearish | 1-hour pattern: Not formed yet (keep waiting)
Long/short score: 9 points (Bearish alignment +3 | MACD bearish +1 | Below zero line +1 | RSI stabilizing +1 | Near EMA20 +1 | Top reversal +2)
Current price 0.3169 RSI 33.01 Support 0.3156 / Resistance 0.3206
Conclusion: Bearish score is dominant (pattern not fully confirmed) → Lean bearish; consider waiting for a rebound to resistance before shorting
$TRX
[SHORT] Current price 0.316900—which way it goes is written on the chart
Here's the conclusion first: short at the current price of 0.316900, with a stop-loss at 0.323259. If it moves above that, admit you're wrong.
· 0.3156 below is support, where buyers may step in; 0.3206 above is resistance, where selling is likely
How to trade (short):
· Entry: Short immediately at the current price of 0.316880
· Stop: 0.323259 (accept a 2.0% loss; don't hold on)
· Target: 0.297742 (first target; take half off when it gets there)
· Position: Start with 1–2% of your funds to test the trade; don't go all in
(Win rates are based on historical statistics and aren't guaranteed; if you copy this trade, always use a stop-loss and manage your position size.)
At $TRX , I'm leaning bearish. The MACD has crossed down, and I'm looking for 0.3067 within this month, at least a 3.2% pullback. RSI is 33, and even a bounce would lack strength. The short-term range is clear: support at 0.3156, resistance at 0.3206. Use resistance as your line in the sand for a short. At 0.3067, take half off; then see whether the rest can drop to 0.2883.
If it breaks straight through 0.3156, that means the short was right. But remember to move your stop-loss near your entry price—don't let a winning trade turn into a losing one.
Trading volume is 6.3M, enough to support a move.
The 20-day moving average at 0.3185 is already overhead. If the rebound can't get above it, the bears are in control.
I personally opened a short at the current price of 0.3169, with a stop-loss at 0.3233, using a small position to test the trade.
Let's do the math: a move down to support at 0.3156 is 0.4%, while a move up to resistance at 0.3206 is 1.2%. There's not enough room here to cover the risk, so don't enter at this level.
If 0.3156 also fails to hold, the next downside area to watch is around 0.3123.
Comment 1 if you agree.
#TRX #波场 #Crypto
[Live Market Scan · $TRX ] (1-hour primary setup + 4H filter)
4H trend: Strongly bearish | 1-hour pattern: Not formed yet (keep waiting)
Long/short score: 9 points (Bearish alignment +3 | MACD bearish +1 | Below zero line +1 | RSI stabilizing +1 | Near EMA20 +1 | Top reversal +2)
Current price 0.3169 RSI 33.01 Support 0.3156 / Resistance 0.3206
Conclusion: Bearish score is dominant (pattern not fully confirmed) → Lean bearish; consider waiting for a rebound to resistance before shorting
$TRX