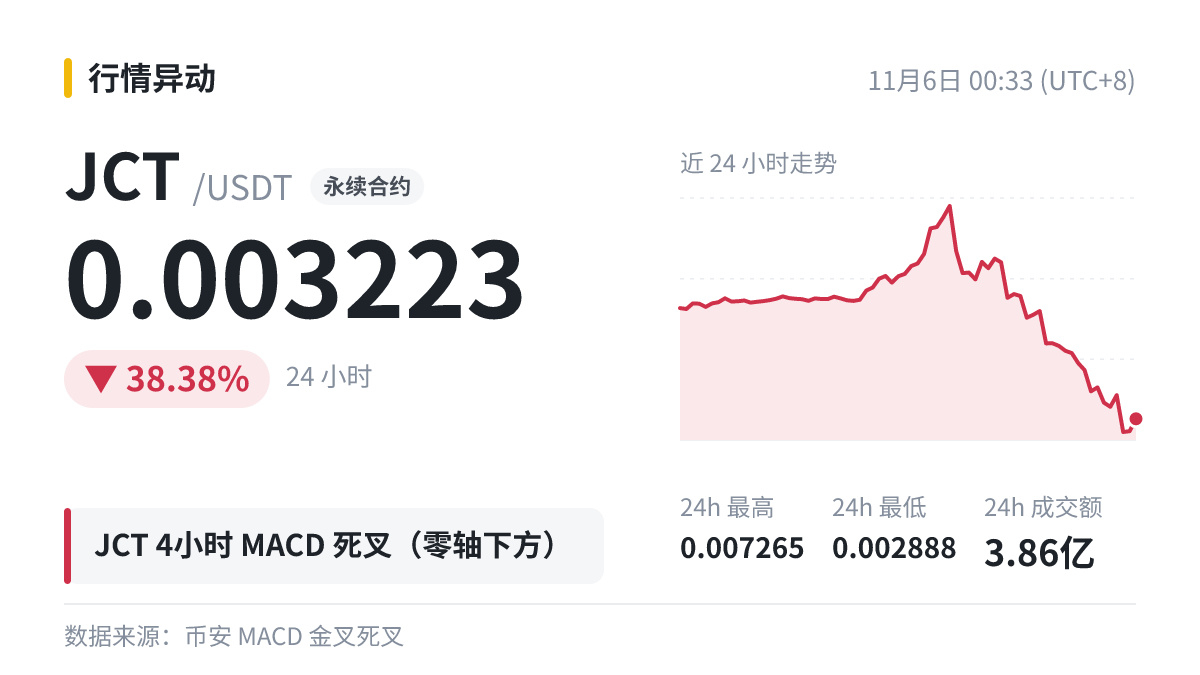
$JCT 4-hour MACD formed a death cross below the zero line, with 7 consecutive histogram bars moving in the opposite direction before the crossover.
Let’s use this data to talk about MACD.
MACD was first introduced by Gerald Appel. Its commonly used parameters are 12, 26, and 9. It gauges trend strength by looking at the distance between the fast and slow EMAs.
The exact way MACD is calculated can vary slightly between charting tools. A crossover that appears before a candlestick closes may disappear by the close, so crossovers confirmed at closing are more reliable.
Indicators can be inaccurate, so don’t skip your stop-loss: it’s more important to plan what you’ll do if you’re wrong than to guess whether you’re right.
#JCT
Let’s use this data to talk about MACD.
MACD was first introduced by Gerald Appel. Its commonly used parameters are 12, 26, and 9. It gauges trend strength by looking at the distance between the fast and slow EMAs.
The exact way MACD is calculated can vary slightly between charting tools. A crossover that appears before a candlestick closes may disappear by the close, so crossovers confirmed at closing are more reliable.
Indicators can be inaccurate, so don’t skip your stop-loss: it’s more important to plan what you’ll do if you’re wrong than to guess whether you’re right.
#JCT