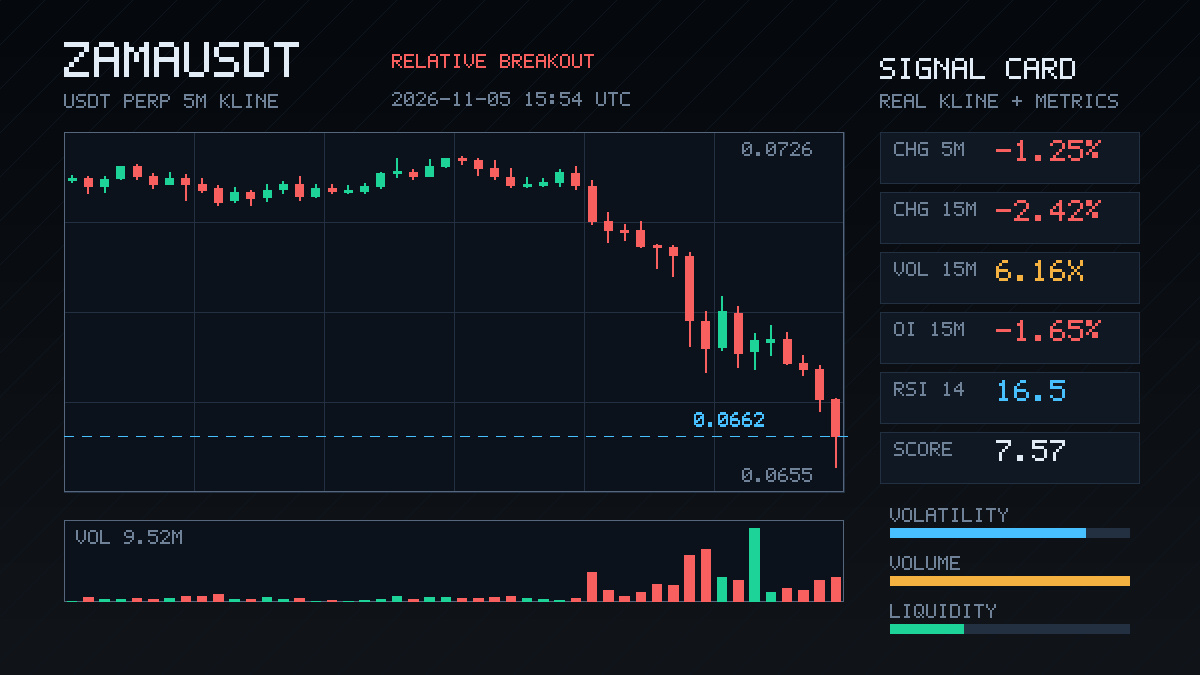
$ZAMA This drop was pretty sharp: the 15m candle plunged 2.42% on volume more than 6 times the norm—not a slow bleed, but a high-volume sell-off.
What’s interesting is that OI fell along with it. Open interest in 1h contracts dropped 3.4%, shedding 670K U in notional value. Price down + open interest down is classic long deleveraging: stop-losses got swept, rather than fresh shorts coming in to drive the drop.
The close has already broken below the lower bound of the last 20 or so 5m candles, and aggressive trade flow is at -18.8%, so selling pressure is clearly dominant. The OI anomaly is at the 99th percentile, ranking 4th across the whole pool. An anomaly lasting several consecutive periods is worth keeping an eye on.
24h trading volume is only 8.4M, so liquidity is thin. A breakdown on this kind of volume expansion can easily continue, but don’t chase too aggressively—when liquidity is thin, rebounds can be just as swift. First, watch whether this 15m candle can reclaim the lower bound of the range. If it can’t, that confirms the breakdown.
What’s interesting is that OI fell along with it. Open interest in 1h contracts dropped 3.4%, shedding 670K U in notional value. Price down + open interest down is classic long deleveraging: stop-losses got swept, rather than fresh shorts coming in to drive the drop.
The close has already broken below the lower bound of the last 20 or so 5m candles, and aggressive trade flow is at -18.8%, so selling pressure is clearly dominant. The OI anomaly is at the 99th percentile, ranking 4th across the whole pool. An anomaly lasting several consecutive periods is worth keeping an eye on.
24h trading volume is only 8.4M, so liquidity is thin. A breakdown on this kind of volume expansion can easily continue, but don’t chase too aggressively—when liquidity is thin, rebounds can be just as swift. First, watch whether this 15m candle can reclaim the lower bound of the range. If it can’t, that confirms the breakdown.