
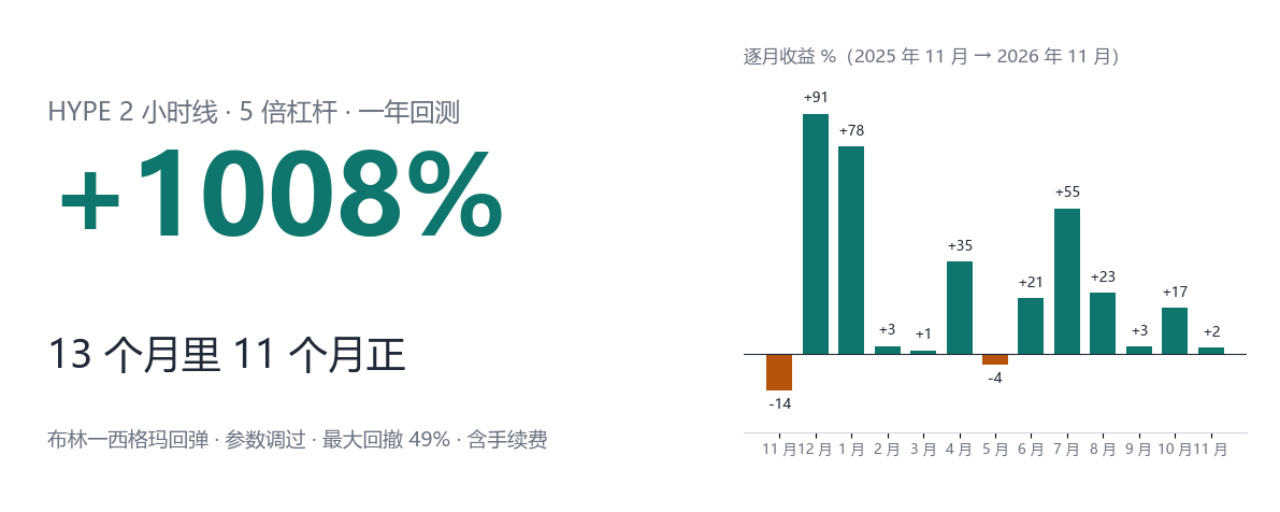

Over the past year, this strategy returned +1008% in a backtest on Binance HYPEUSDT 2-hour candles, making money in 11 out of 13 months (parameters tuned, 5x leverage, fees included, maximum drawdown 49%). Backtest results only; not investment advice.
It's a Bollinger one-sigma rebound strategy on FMZ. With the original parameters, it was profitable in only 5 of 13 months. I tuned the parameters using this year's data; I'll discuss the risk of overfitting in the final section.
The example chart uses actual Binance futures HYPEUSDT 2-hour candlesticks (UTC), and the signals were recalculated offline according to the source code rules. Profit and loss figures are from an AlgoRover local backtest, using data up to November 5 at 21:00 Beijing time.
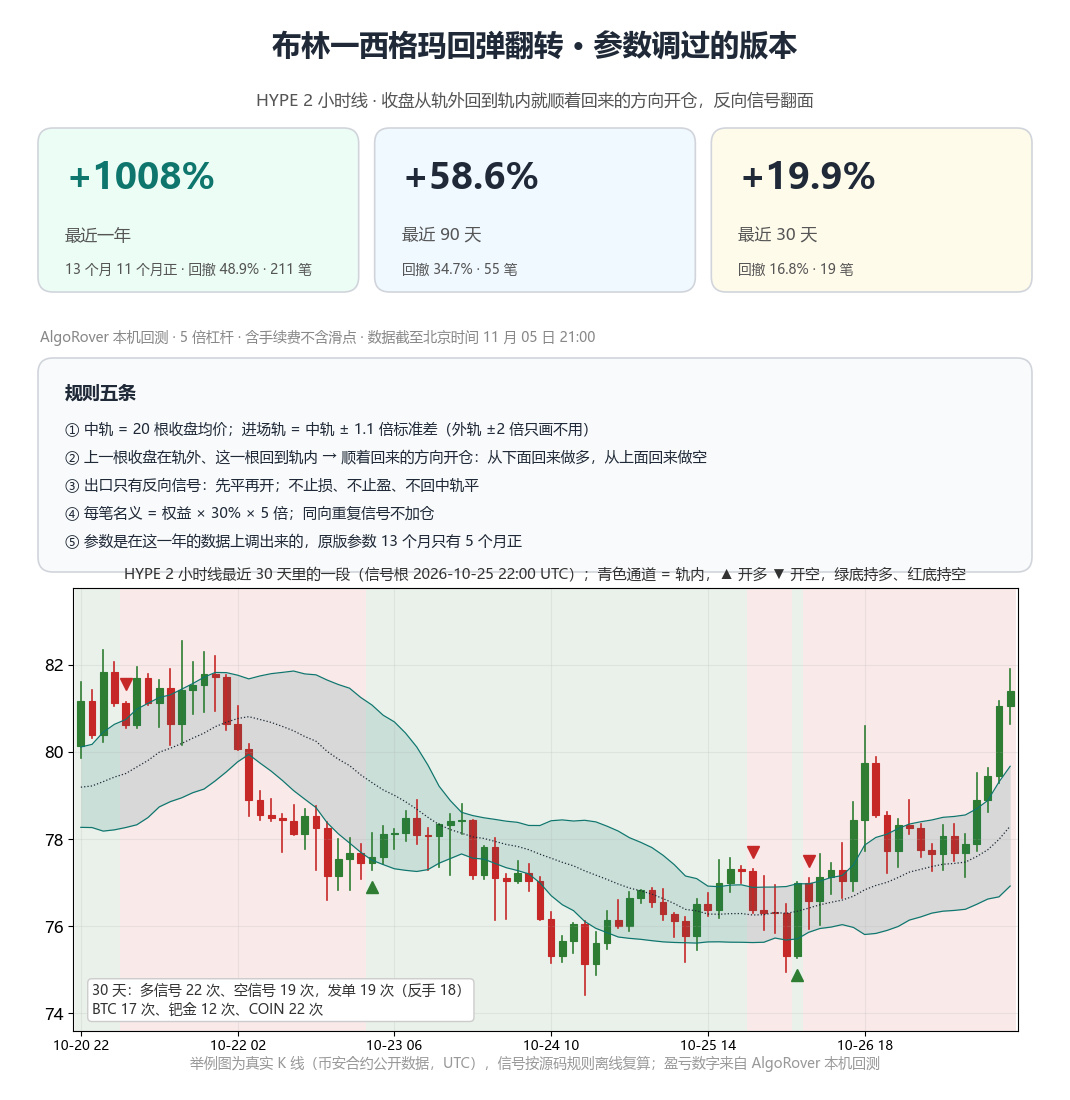
Figure 0: The whole account and the rules at a glance.
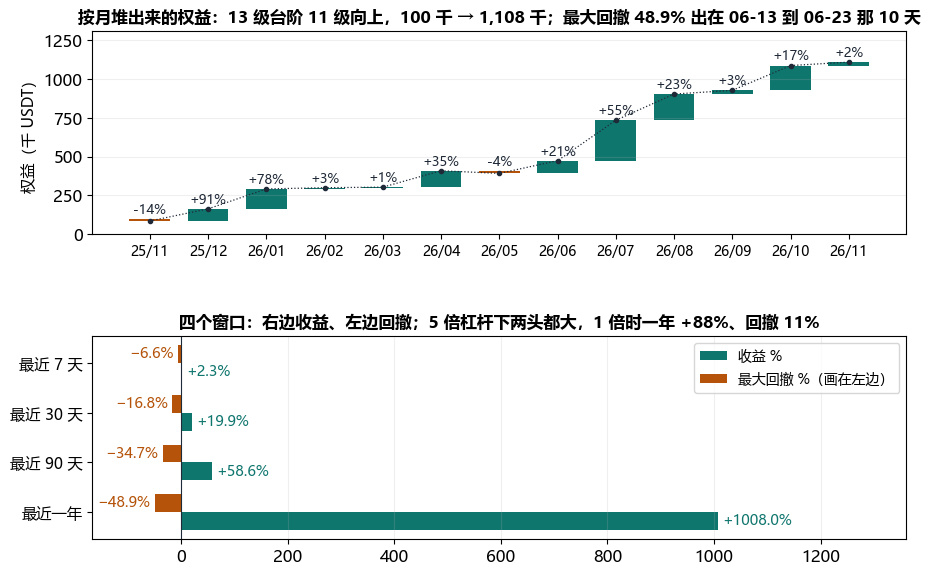
Figure 1: The upper chart shows monthly steps in equity; the lower chart shows returns and drawdowns across four windows. 211 trades in a year, with a 65% win rate.
Three lines: the middle band, the entry band, and the outer band
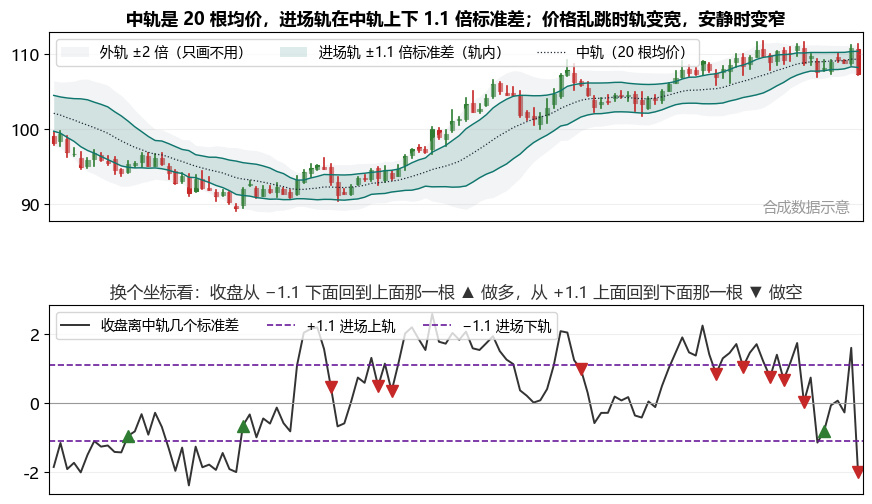
Figure 2: The upper chart shows the three lines; the lower chart uses a scale showing the number of standard deviations from the middle band.
The middle band is the 20-bar average closing price, and the entry bands are 1.1 standard deviations above and below the middle band. The outer bands at ±2 standard deviations are shown but not used—the “Bollinger” in the name is only half the story.
It’s a mean-reversion strategy: an order is placed only when the close returns inside the band from outside
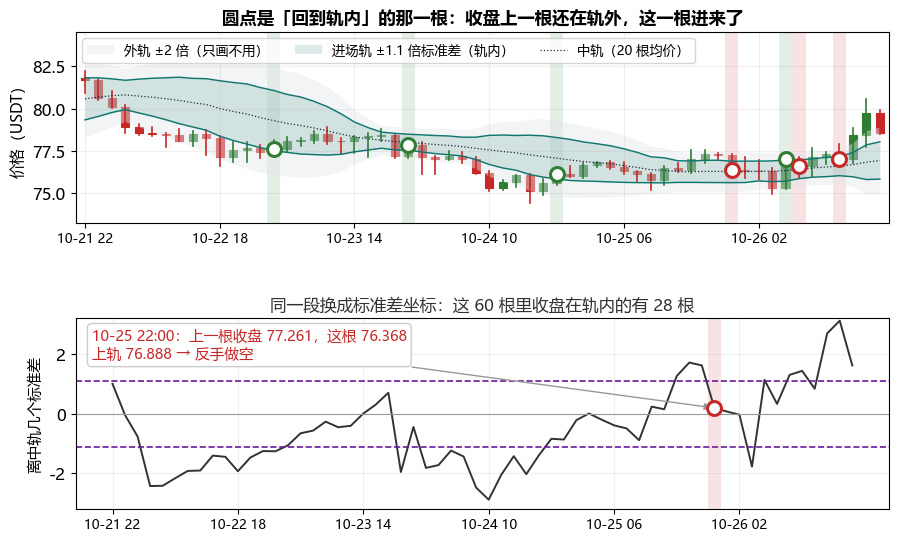
Figure 3: The dot marks the bar that “returned inside the band”; the lower chart shows the standard-deviation scale for the same period.
At 2026-10-25 22:00, the previous bar closed at 77.261, outside the upper band at 76.888. This bar closed at 76.368, back inside the band, so the strategy reversed into a short. Over 30 days there were 22 long signals and 19 short signals, but only 19 orders were actually placed.
The only exit is an opposite signal; there is no stop-loss or take-profit
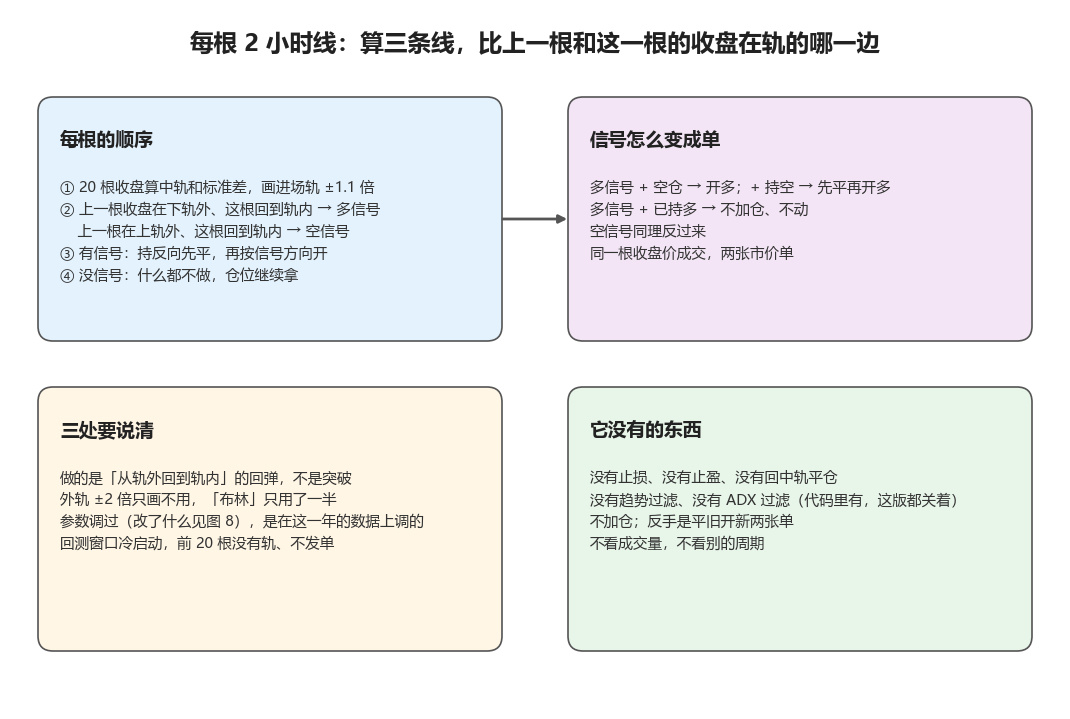
Figure 4: The sequence of each bar, how signals become orders, three easy-to-miss details, and what the strategy doesn’t have.
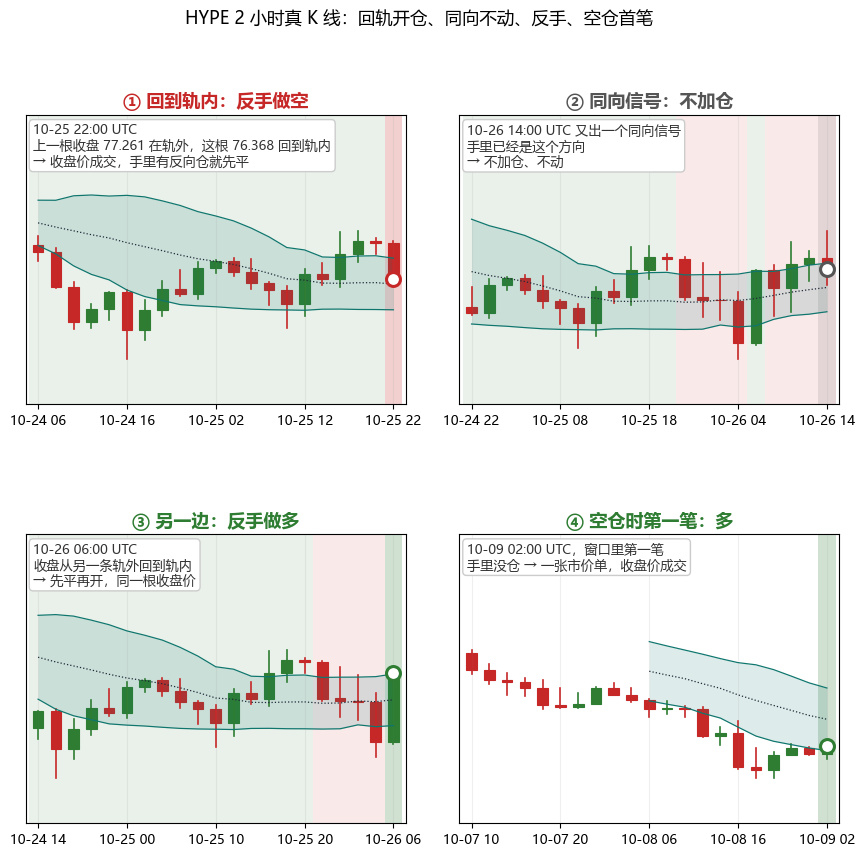
Figure 5: ① Enter when price returns inside the band; ② don’t add to a position on a same-direction signal; ③ reverse on a signal from the other side; ④ the first trade when flat.
A position is held until the opposite band gives a signal. There’s no stop-loss, take-profit, or closing at the middle band in between. Each trade’s notional is 30% of equity multiplied by 5. With 100,000 in capital, that’s 150,000; this trade opened 1,964 HYPE at 76.368.
HYPE over the last 30 days: 41 signals, 19 orders placed
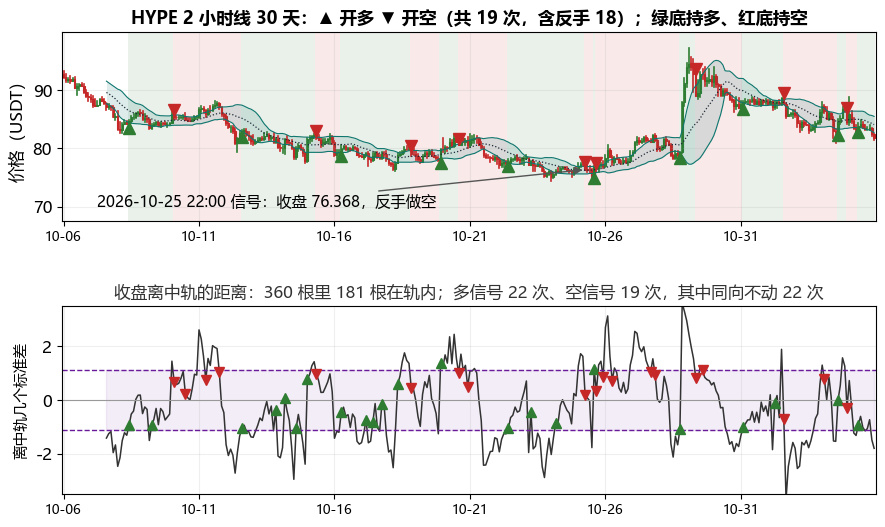
Figure 6: In the upper chart, ▲▼ mark the bars where orders were placed; green shading indicates a long position and red shading a short. The lower chart shows the close’s distance from the middle band in standard deviations.
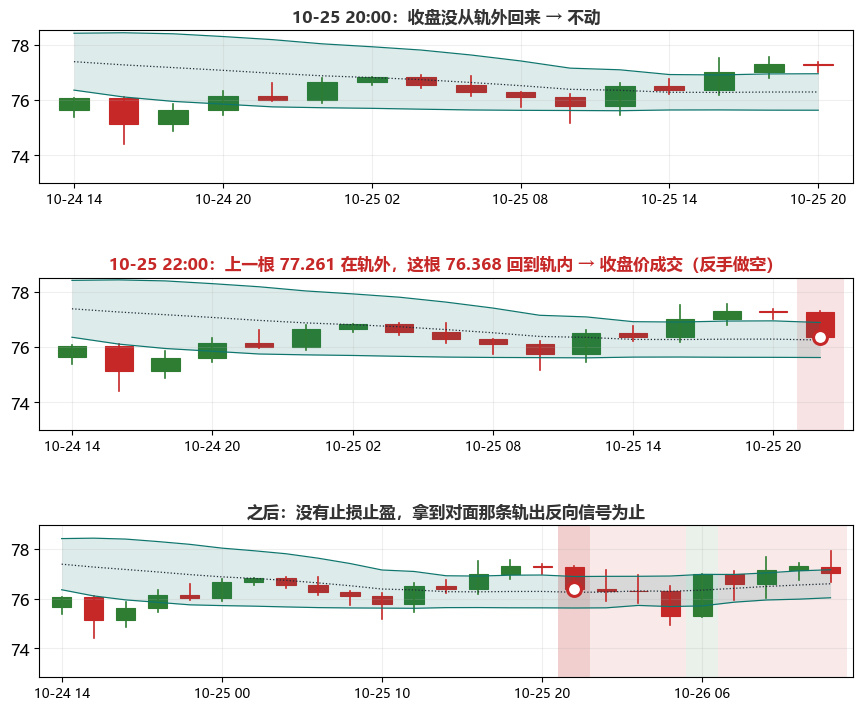
Figure 6b: The previous bar hadn’t returned inside the band; the trade was entered when price returned inside at 22:00, then held until a signal from the opposite band.
Of the 19 trades, 18 were reversals: 10 longs and 9 shorts. The median holding period was 18 bars (36 hours), and the longest was 37 bars. There were 22 repeated same-direction signals, none of which added to a position.
The same rule applied across four markets
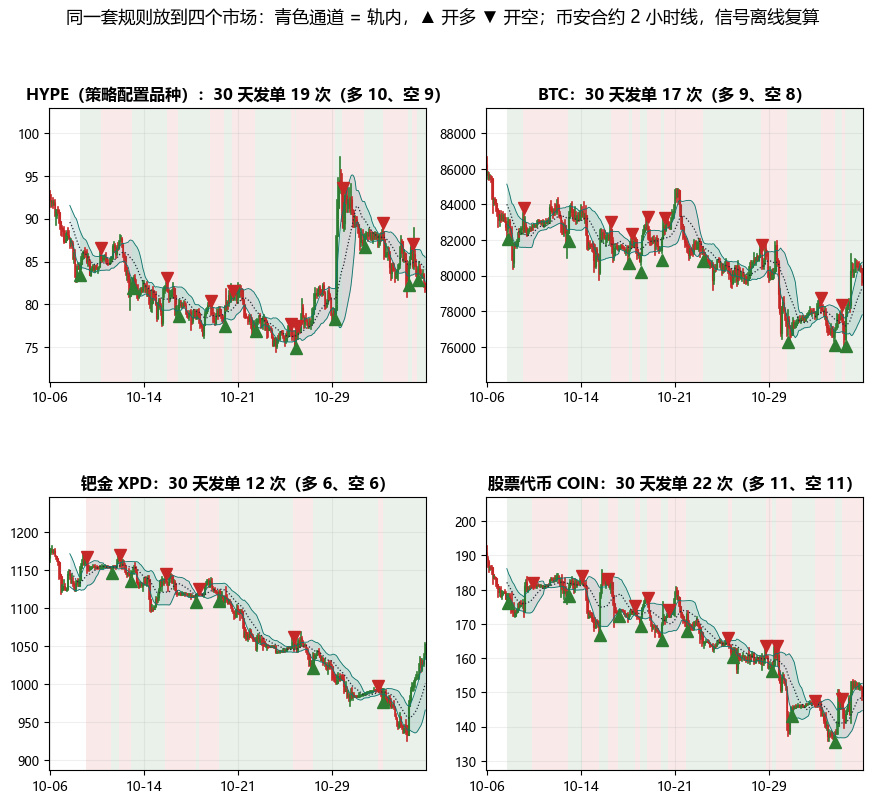
Figure 7: The most recent 30 days for HYPE, BTC, palladium, and COIN; ▲ marks longs and ▼ shorts.
BTC had 17 signals, palladium 12, and COIN 22. Price breaks out of the band and then returns in every market, so every market gets trades.
What happens when you tweak the parameters?
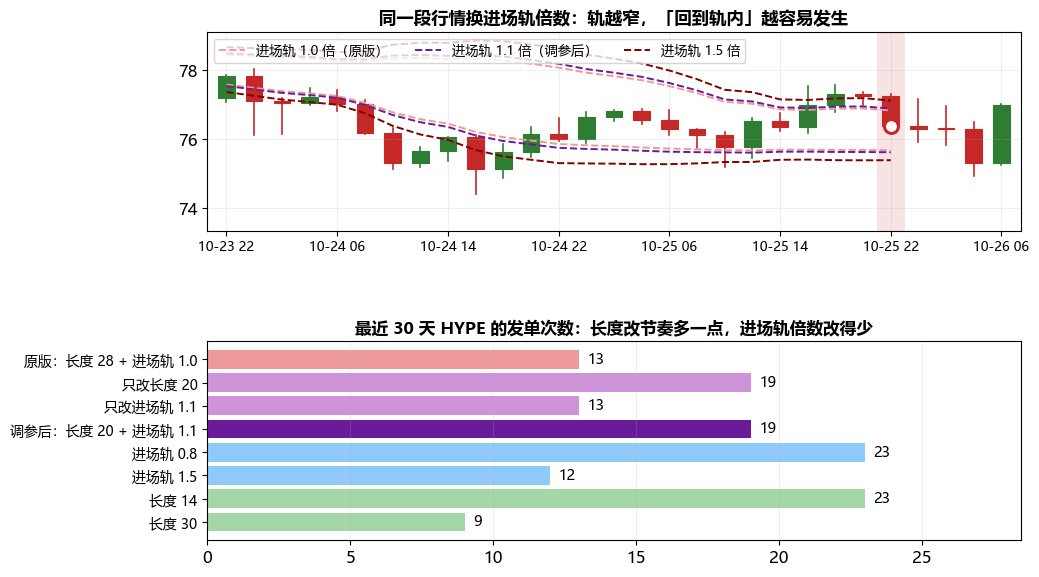
Figure 8: The upper chart shows the same market period with different entry-band multipliers; the lower chart shows the number of orders placed over 30 days for each parameter set.
The original parameters placed 13 orders in 30 days; the tuned version placed 19, with all the extra trades coming from shortening the Bollinger length. Widening the entry band to 1.5× left 12 trades; narrowing it to 0.8× raised that to 23.
It needs a market that swings back and forth, returning inside the band after each move outside it
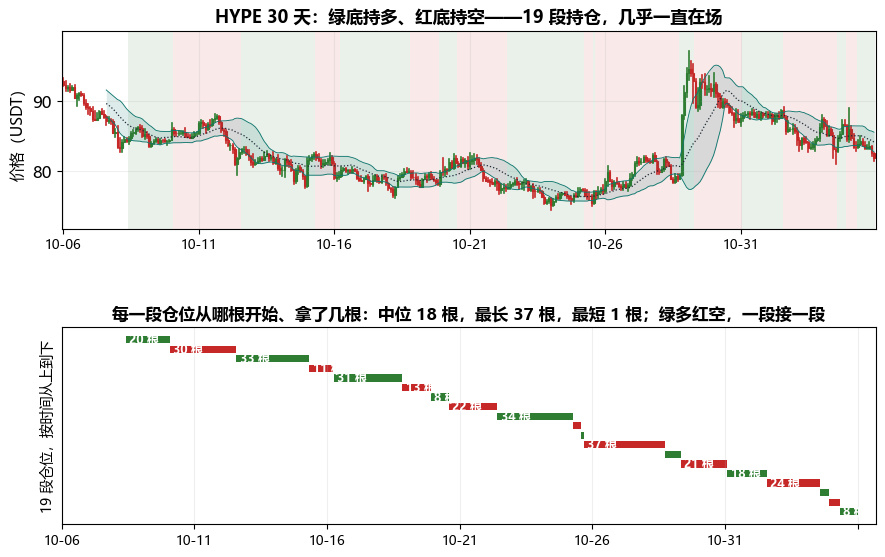
Figure 9: The upper chart shows position shading over 30 days; the lower chart shows when each position began and how many bars it lasted.
The best month was December 2025 at +90.5%; the worst was November 2025 at −13.9%. Over the most recent 90 days, returns were +58.6% with a 34.7% drawdown; over the most recent 30 days, returns were +19.9%. The 49% drawdown came from holding a position against a one-way market while waiting for a signal from the opposite band: the short opened on June 14 was held for three and a half days as HYPE rose from 60 to 72, losing 20% of its notional on that trade.
Five things that are easy to get wrong
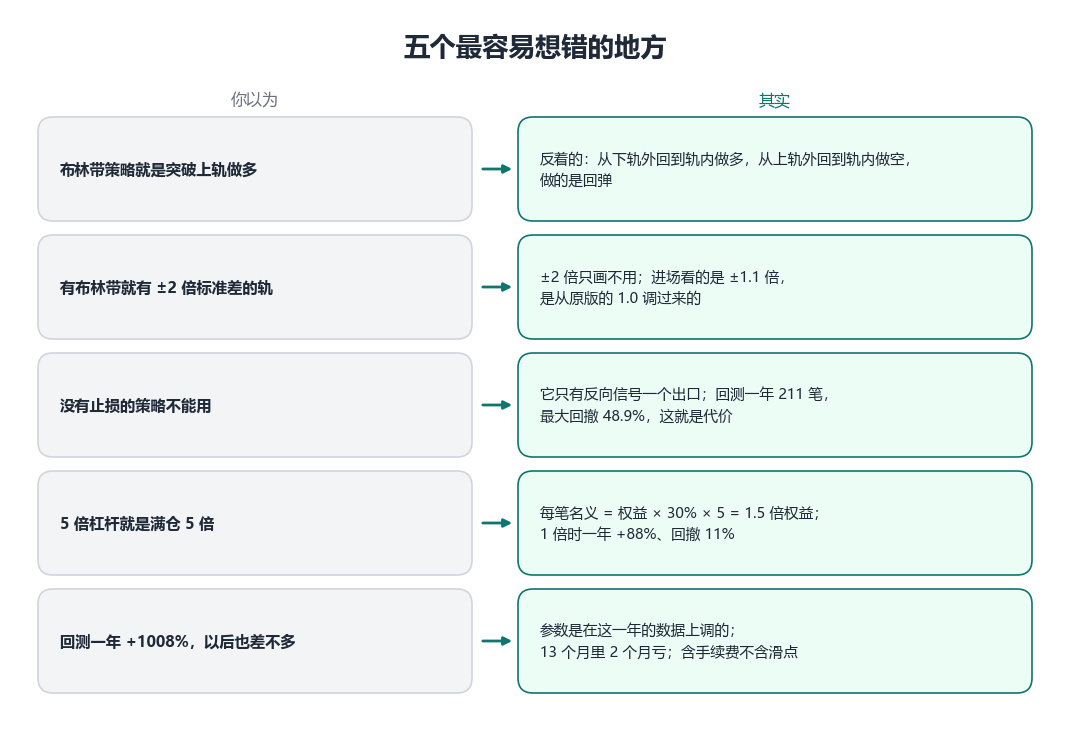
Figure 10: Common misconceptions on the left, the actual rules on the right.
Remember this: check the bands first, then see which side of the band the previous close was on
The parameters were tuned on this year’s data; no one knows whether they’ll perform the same out of sample. To read its signals, check the entry band first, then see whether the previous close was outside it.
Three things users should remember
Only place an order when price returns inside the band from outside; a breakout beyond the band doesn’t count
The only exit is an opposite signal; positions are often held for a day or two
Parameters are tuned to this year’s data; the 5× leverage backtest had a 49% drawdown