
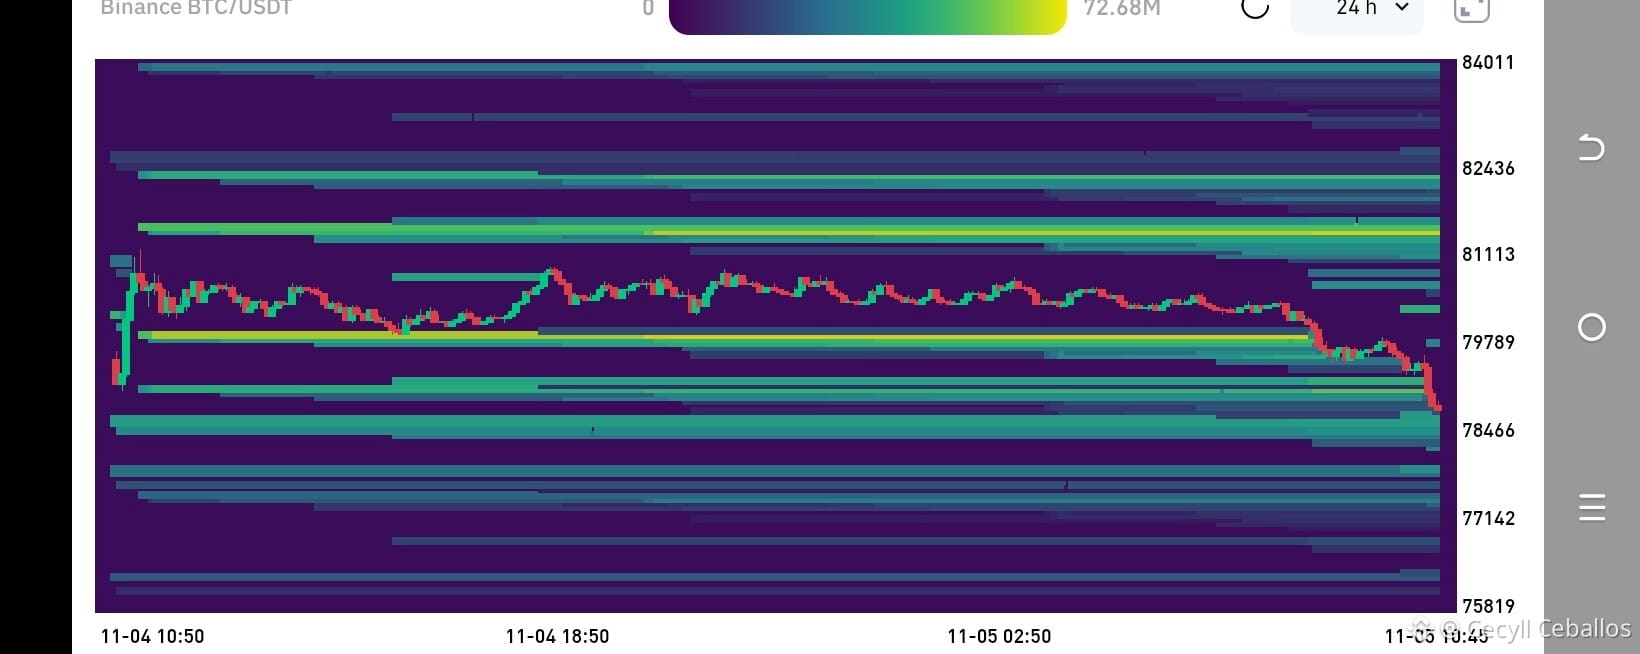

Bear trap in BTC before tomorrow’s Unemployment Report (NFP)? 🔥📊
The market just made a classic stop-hunting move right as the bell rang on Wall Street. If you’re trading $BTC today, pay close attention to what the 24-hour liquidation heatmap and the U.S. macroeconomic front are revealing:
🗽 1. What’s happening at the New York open and with Unemployment?
Mixed open and rotation on Wall Street: While Dow Jones futures (+0.63%) and the S&P 500 (+0.23%) held onto their positive tone after yesterday’s rally, the The Nasdaq 100 opened down between 0.50% and 1.2% amid selling in the semiconductor and AI sectors following reports from Qualcomm and Arm (Upstox, XTB). That initial pressure on tech stocks dragged Bitcoin down during the first hour of the U.S. session.
Today’s surprise in weekly jobless claims: At 8:30 AM ET, the latest Initial Jobless Claims data came out, falling by 6,000 claims to 189,000 (down from 195,000 last week), the lowest level since mid-July and marking 8 consecutive weeks below 200,000 (ClickOrlando / AP, Trading Economics). Such a strong labor market is keeping U.S. 10-year Treasury yields near 4.89% (Upstox).
Tomorrow’s main event (NFP and Unemployment Rate): Tomorrow, November 6, at 8:30 AM ET, the Bureau of Labor Statistics (BLS) will release its official October report. The consensus forecasts 65,000 new Nonfarm Payrolls (NFP) jobs —up from September’s 29,000—while the unemployment rate is expected to remain at 4.2% (ClickOrlando / AP).
₿ 2. What’s happening with Bitcoin right now?
Leverage flush: After rebounding 7.1% yesterday from ~$75,600 to touch $81,000 and liquidate $380 million in short positions (Bitcoin Foundation), Bitcoin spent the early hours moving sideways above $80,000 with moderate spot demand (Bitkub).Pre-news sweep: Market makers took advantage of Nasdaq’s weakness at the New York open to push the price down, flush out late longs who entered above $80,000, and reload liquidity ahead of tomorrow’s unemployment data.
🔥 3. Heatmap Analysis: The Cluster and the Floor
The swept cluster ($79,789–$80,000): Notice the brightest yellow band on the chart (with concentration peaks of up to 72.68M USDT). The price orbited above this liquidity pool for more than 18 hours until it finally broke through decisively to absorb all those stops . Now $79,789–$80,000 becomes the zone to reclaim to confirm bullish strength.
The upper clusters (bullish magnets): Two dense blocks of short liquidity remained untouched above: the main cluster between $81,113 and $81,500 (bright yellow/green band) and a second level at $82,436 (aligned with the key $82,000 resistance watched by institutional markets, according to XTB).
The current floor ($78,466–$78,800): Right where the decline is stalling at this moment (10:45), a significant cushion of liquidity in green/turquoise shades appears above $78,466. As long as Bitcoin defends this floor on hourly closes, this decline has all the hallmarks of a liquidity sweep (stop hunt) to then target the upper cluster at $81,113.
The emergency floor ($77,142 and $75,819): If the market breaks through $78,466 on high volume, the next support pools appear at more moderate levels at $77,142 and at the bottom of the range at $75,819.
💡 Trading takeaway: The market has already cleared the heavy liquidity at $79,789. Watch the reaction at the $78,466 floor: if it absorbs selling pressure today, tomorrow’s unemployment data could send price straight toward the $81,113–$82,436 liquidity cluster. Manage your risk and reduce leverage before 8:30 AM ET tomorrow!
If you like my analysis, give it a like. If you follow me, I’ll follow you.
#Bitcoin #BTC #BinanceSquare #CryptoNews #NFP #CryptoTrading #Liquidity #WallStreet #TechnicalAnalysis #BTCUSDT