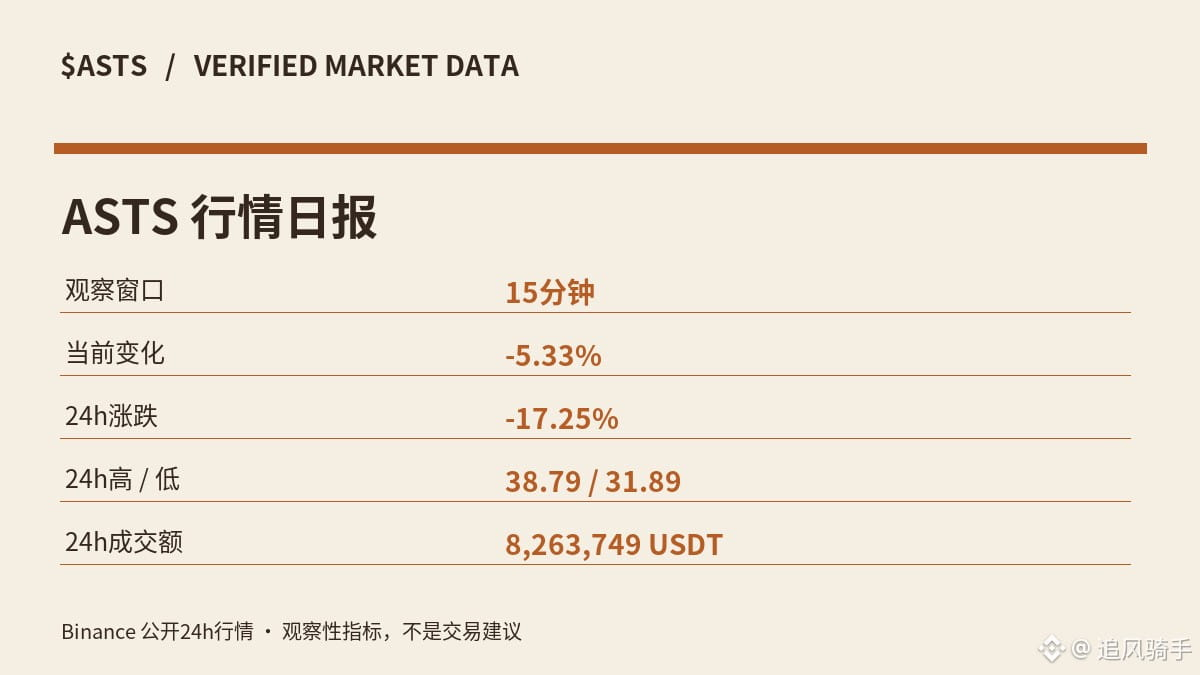
【Next-period monitoring · Counterevidence】$ASTS 15-minute decline of 5.33% 🔴📉
【Fact snapshot】This is a 15-minute anomaly snapshot from 2026-11-05 22:48:58: price 32.13 USDT; cumulative 24-hour trading volume 8.467 million USDT.
【How to verify next】First set invalidation conditions: if the price quickly recovers above 32.13 USDT, the sharp-drop rebound scenario must be reassessed. Then verify continuation: only consider continued weakness if the next 15-minute candle remains below the recorded price of 32.13 USDT and trading volume over the same period continues to confirm it. If the next position data diverges from the price direction, do not carry forward the original assessment.
【Indicator readings】
· Large-trader positions: large-trader long/short position ratio 2.525
· Large-trader accounts: large-trader long/short account ratio 3.630
· Accounts: overall-market long/short account ratio 2.507; this is a ratio of account numbers, not net aggressive buying
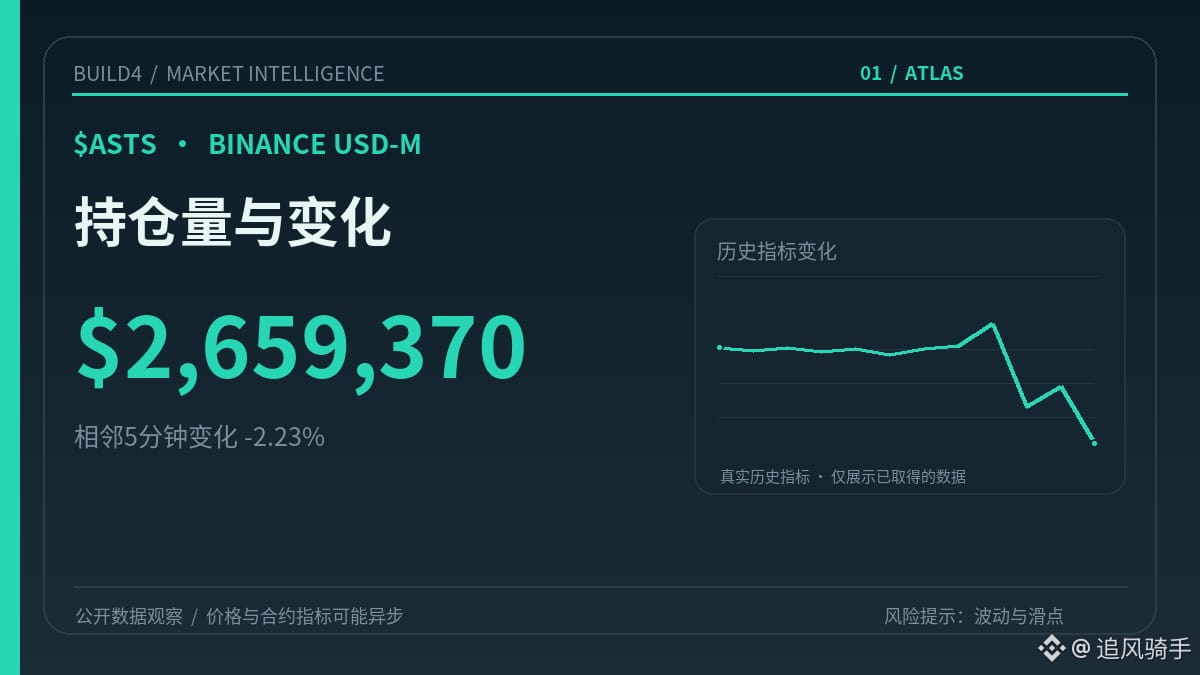
· Positions: nominal open interest approximately 2.659 million USDT, down 2.23% over the previous 5 minutes (valuation includes price effects)
· Funding rate: estimated rate unavailable; the two settled rates were +0.0075% / +0.0283% (estimated and settled rates should not be conflated)
【Market assessment】First look for evidence that does not support a one-sided inference, then see whether the next period can confirm it. The long/short ratio reflects the distribution of accounts, not aggressive contract trading volume; when combining it with large-trader indicators, it is especially important to distinguish their measurement bases. Technical readings first need confirmation from data over the same period; a single snapshot cannot replace trend structure. Changes across multiple readings do not constitute a standalone buy or sell signal; updated readings still need to be monitored.
【Measurement caveats】The current funding rate does not provide a clear directional interpretation and cannot be used as a substitute for trading-volume data. Indicator sampling times may not be synchronized, so wait for the next data check.
【Research limitations】This is currently just a set of snapshots of price, positions, and fees; changes in the same direction do not prove a causal chain of trading activity.
Risk: Sharp declines can easily be followed by rebounds, slippage, and mispricing; the above is an analysis based on public data, not a trading instruction.
【Fact snapshot】This is a 15-minute anomaly snapshot from 2026-11-05 22:48:58: price 32.13 USDT; cumulative 24-hour trading volume 8.467 million USDT.
【How to verify next】First set invalidation conditions: if the price quickly recovers above 32.13 USDT, the sharp-drop rebound scenario must be reassessed. Then verify continuation: only consider continued weakness if the next 15-minute candle remains below the recorded price of 32.13 USDT and trading volume over the same period continues to confirm it. If the next position data diverges from the price direction, do not carry forward the original assessment.
【Indicator readings】
· Large-trader positions: large-trader long/short position ratio 2.525
· Large-trader accounts: large-trader long/short account ratio 3.630
· Accounts: overall-market long/short account ratio 2.507; this is a ratio of account numbers, not net aggressive buying
· Positions: nominal open interest approximately 2.659 million USDT, down 2.23% over the previous 5 minutes (valuation includes price effects)
· Funding rate: estimated rate unavailable; the two settled rates were +0.0075% / +0.0283% (estimated and settled rates should not be conflated)
【Market assessment】First look for evidence that does not support a one-sided inference, then see whether the next period can confirm it. The long/short ratio reflects the distribution of accounts, not aggressive contract trading volume; when combining it with large-trader indicators, it is especially important to distinguish their measurement bases. Technical readings first need confirmation from data over the same period; a single snapshot cannot replace trend structure. Changes across multiple readings do not constitute a standalone buy or sell signal; updated readings still need to be monitored.
【Measurement caveats】The current funding rate does not provide a clear directional interpretation and cannot be used as a substitute for trading-volume data. Indicator sampling times may not be synchronized, so wait for the next data check.
【Research limitations】This is currently just a set of snapshots of price, positions, and fees; changes in the same direction do not prove a causal chain of trading activity.
Risk: Sharp declines can easily be followed by rebounds, slippage, and mispricing; the above is an analysis based on public data, not a trading instruction.