🚨 $RENDER /USDT - Market Update (Perp) 📉📈
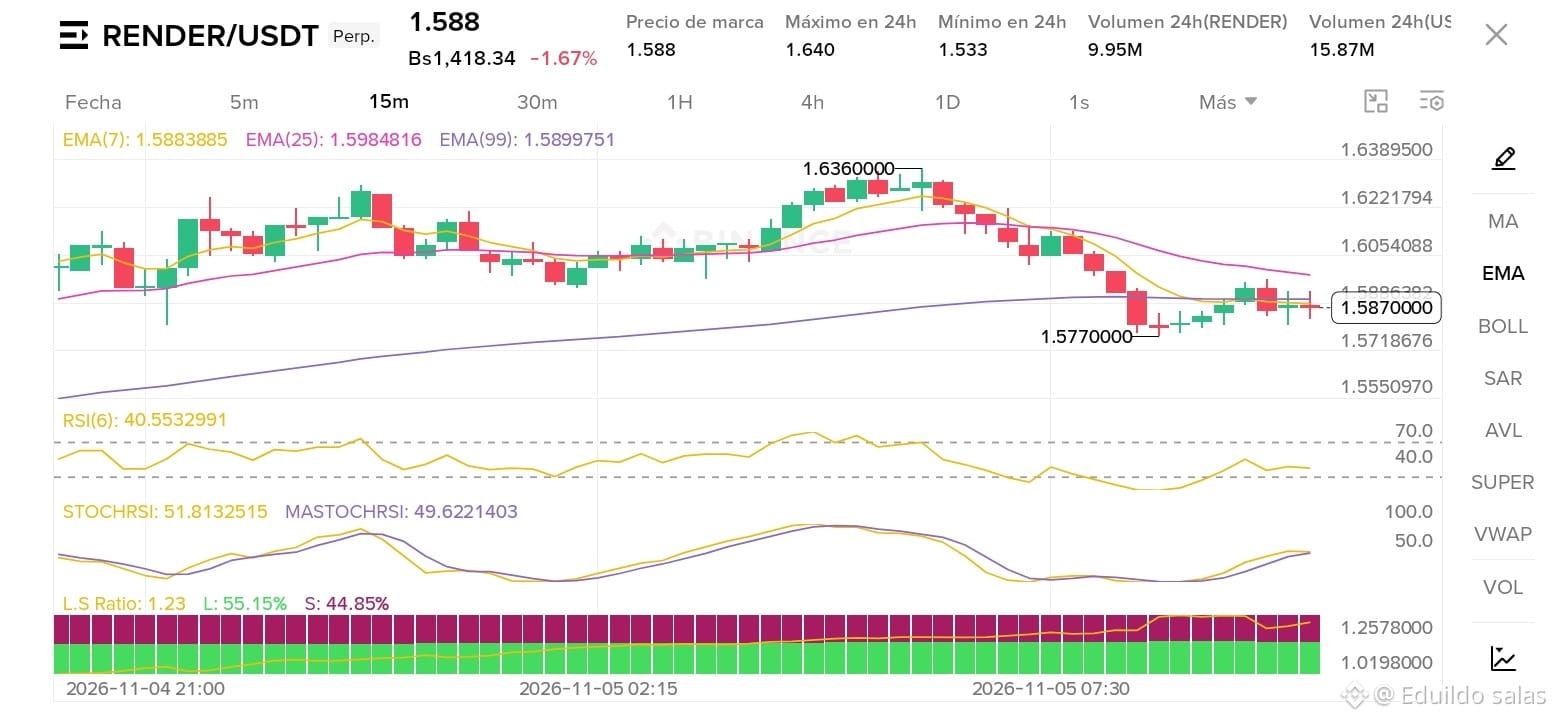
Taking a look at the current RENDER chart, the price is trading at $1.588, showing a slight pullback of -1.67% in recent hours. Let’s analyze the key price action points and indicators:
24-hour range: High of $1.640 and low of $1.533, with active trading volume of 9.95M RENDER (15.87M USDT).
Price Action and Support/Resistance: After reaching a local peak at $1.636, the price underwent a bearish correction until it found significant support near $1.577, from which it has attempted to stabilize and make a slight rebound within a narrow range.
Moving Averages (EMA): The EMA(7), EMA(25), and EMA(99) lines are very close together around the current $1.58–$1.59 zone, reflecting a short-term consolidation or indecision phase as the market seeks to determine its next direction.
Technical Indicators (RSI and StochRSI):
The RSI(6) is at 40.55, leaning slightly toward the bearish zone but not yet entering extreme oversold territory.
The StochRSI shows a bullish crossover in the middle zone (51.81 vs 49.62), suggesting a possible short-term recovery if it manages to break the immediate resistance.
Market Sentiment (Long/Short Ratio): The Long/Short ratio is at 1.23, with 55.15% long positions (Long) versus 44.85% short positions (Short), demonstrating that the community remains predominantly bullish and expects a rebound from these levels.
🔍 What to watch: A clear break above the EMA zone and established support could mark the beginning of a new move toward the $1.64 resistance. Keep your risk management active and trade with caution! 📊⚡
#RENDER #BinanceSquare #SouthKoreaSeeksCryptoTaxDelayUntil2029 #BinancePick
Taking a look at the current RENDER chart, the price is trading at $1.588, showing a slight pullback of -1.67% in recent hours. Let’s analyze the key price action points and indicators:
24-hour range: High of $1.640 and low of $1.533, with active trading volume of 9.95M RENDER (15.87M USDT).
Price Action and Support/Resistance: After reaching a local peak at $1.636, the price underwent a bearish correction until it found significant support near $1.577, from which it has attempted to stabilize and make a slight rebound within a narrow range.
Moving Averages (EMA): The EMA(7), EMA(25), and EMA(99) lines are very close together around the current $1.58–$1.59 zone, reflecting a short-term consolidation or indecision phase as the market seeks to determine its next direction.
Technical Indicators (RSI and StochRSI):
The RSI(6) is at 40.55, leaning slightly toward the bearish zone but not yet entering extreme oversold territory.
The StochRSI shows a bullish crossover in the middle zone (51.81 vs 49.62), suggesting a possible short-term recovery if it manages to break the immediate resistance.
Market Sentiment (Long/Short Ratio): The Long/Short ratio is at 1.23, with 55.15% long positions (Long) versus 44.85% short positions (Short), demonstrating that the community remains predominantly bullish and expects a rebound from these levels.
🔍 What to watch: A clear break above the EMA zone and established support could mark the beginning of a new move toward the $1.64 resistance. Keep your risk management active and trade with caution! 📊⚡
#RENDER #BinanceSquare #SouthKoreaSeeksCryptoTaxDelayUntil2029 #BinancePick