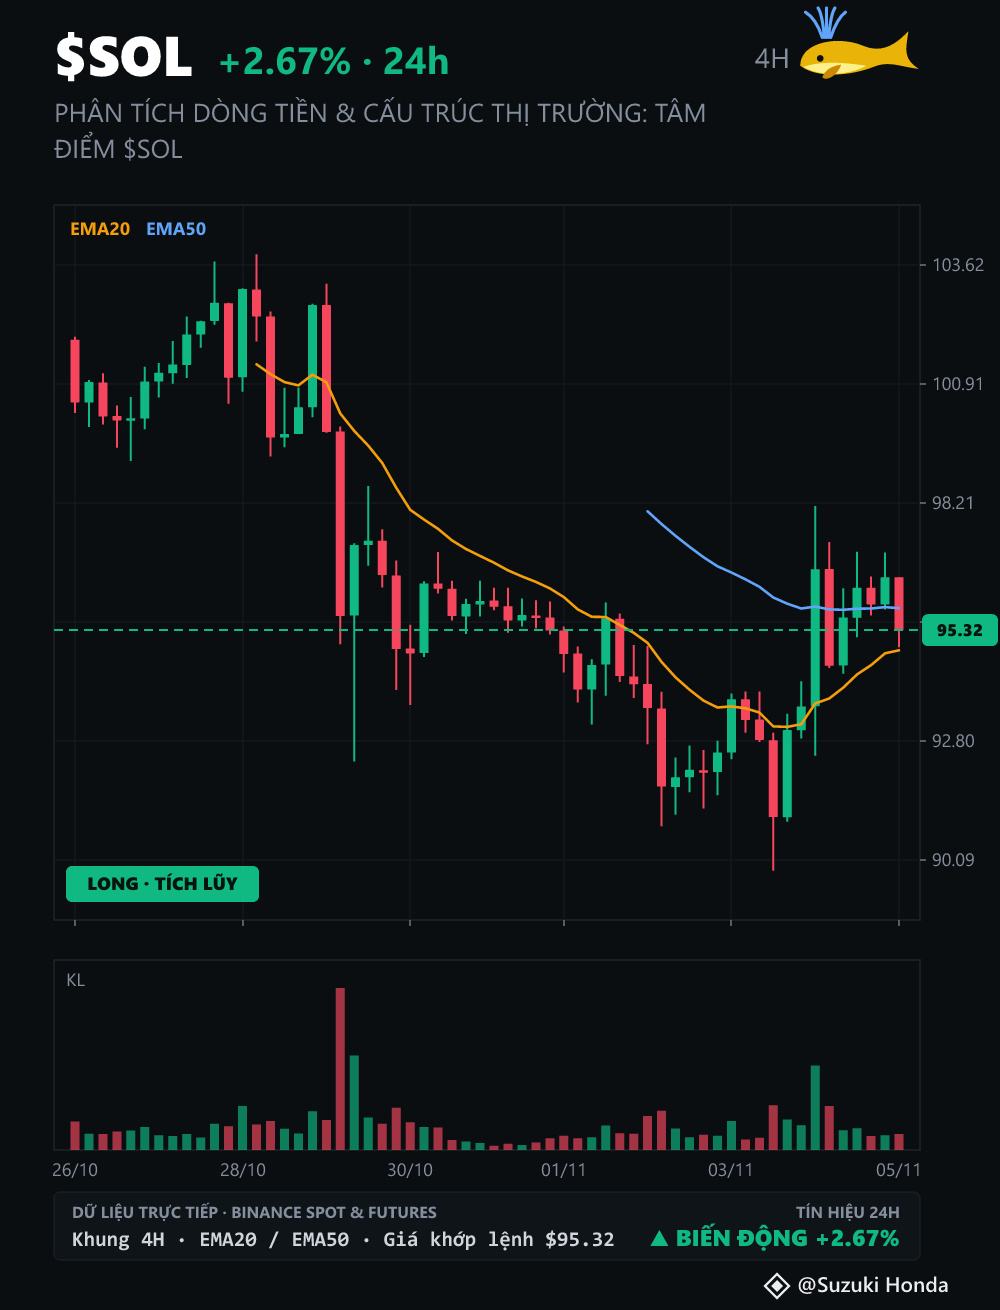
📊 CASH FLOW & MARKET STRUCTURE ANALYSIS: $SOL IN FOCUS
Today’s overall market picture shows the Fear & Greed Index at 50. Standing out on the board, $SOL is trading around $95.32, with a 24-hour change of +2.67%.
• Orderflow & Smart Money Footprints: The Taker Buy ratio on the 4H timeframe accounts for as much as 45% of total liquidity, despite fluctuations around EMA20 ($94.75) and EMA50 ($96.44).
• Orderbook Depth: Buyers are building a Bid Wall at $95.00, accounting for 66% of orderbook pressure, to defend the buffer zone at $89.86 (RSI14 is at 52, and Fear & Greed is at 50).
• Whale-Tracking Strategy (cross-checking capital flows of $BTC and $ETH ): Watch the reaction at the accumulation zone of $92.94; if the $95.50 Sell Wall is fully absorbed and resistance at $98.14 is broken, the next target opens up at $99.61 (stop-loss below $87.88).
What do you think the next move for $SOL will be? Leave a comment below!
#SOL #Write2Earn #BinanceSquare #MarketOverview #Analysis
DYOR - Not investment advice.
Today’s overall market picture shows the Fear & Greed Index at 50. Standing out on the board, $SOL is trading around $95.32, with a 24-hour change of +2.67%.
• Orderflow & Smart Money Footprints: The Taker Buy ratio on the 4H timeframe accounts for as much as 45% of total liquidity, despite fluctuations around EMA20 ($94.75) and EMA50 ($96.44).
• Orderbook Depth: Buyers are building a Bid Wall at $95.00, accounting for 66% of orderbook pressure, to defend the buffer zone at $89.86 (RSI14 is at 52, and Fear & Greed is at 50).
• Whale-Tracking Strategy (cross-checking capital flows of $BTC and $ETH ): Watch the reaction at the accumulation zone of $92.94; if the $95.50 Sell Wall is fully absorbed and resistance at $98.14 is broken, the next target opens up at $99.61 (stop-loss below $87.88).
What do you think the next move for $SOL will be? Leave a comment below!
#SOL #Write2Earn #BinanceSquare #MarketOverview #Analysis
DYOR - Not investment advice.