
$ETH Evening outlook: November 5.
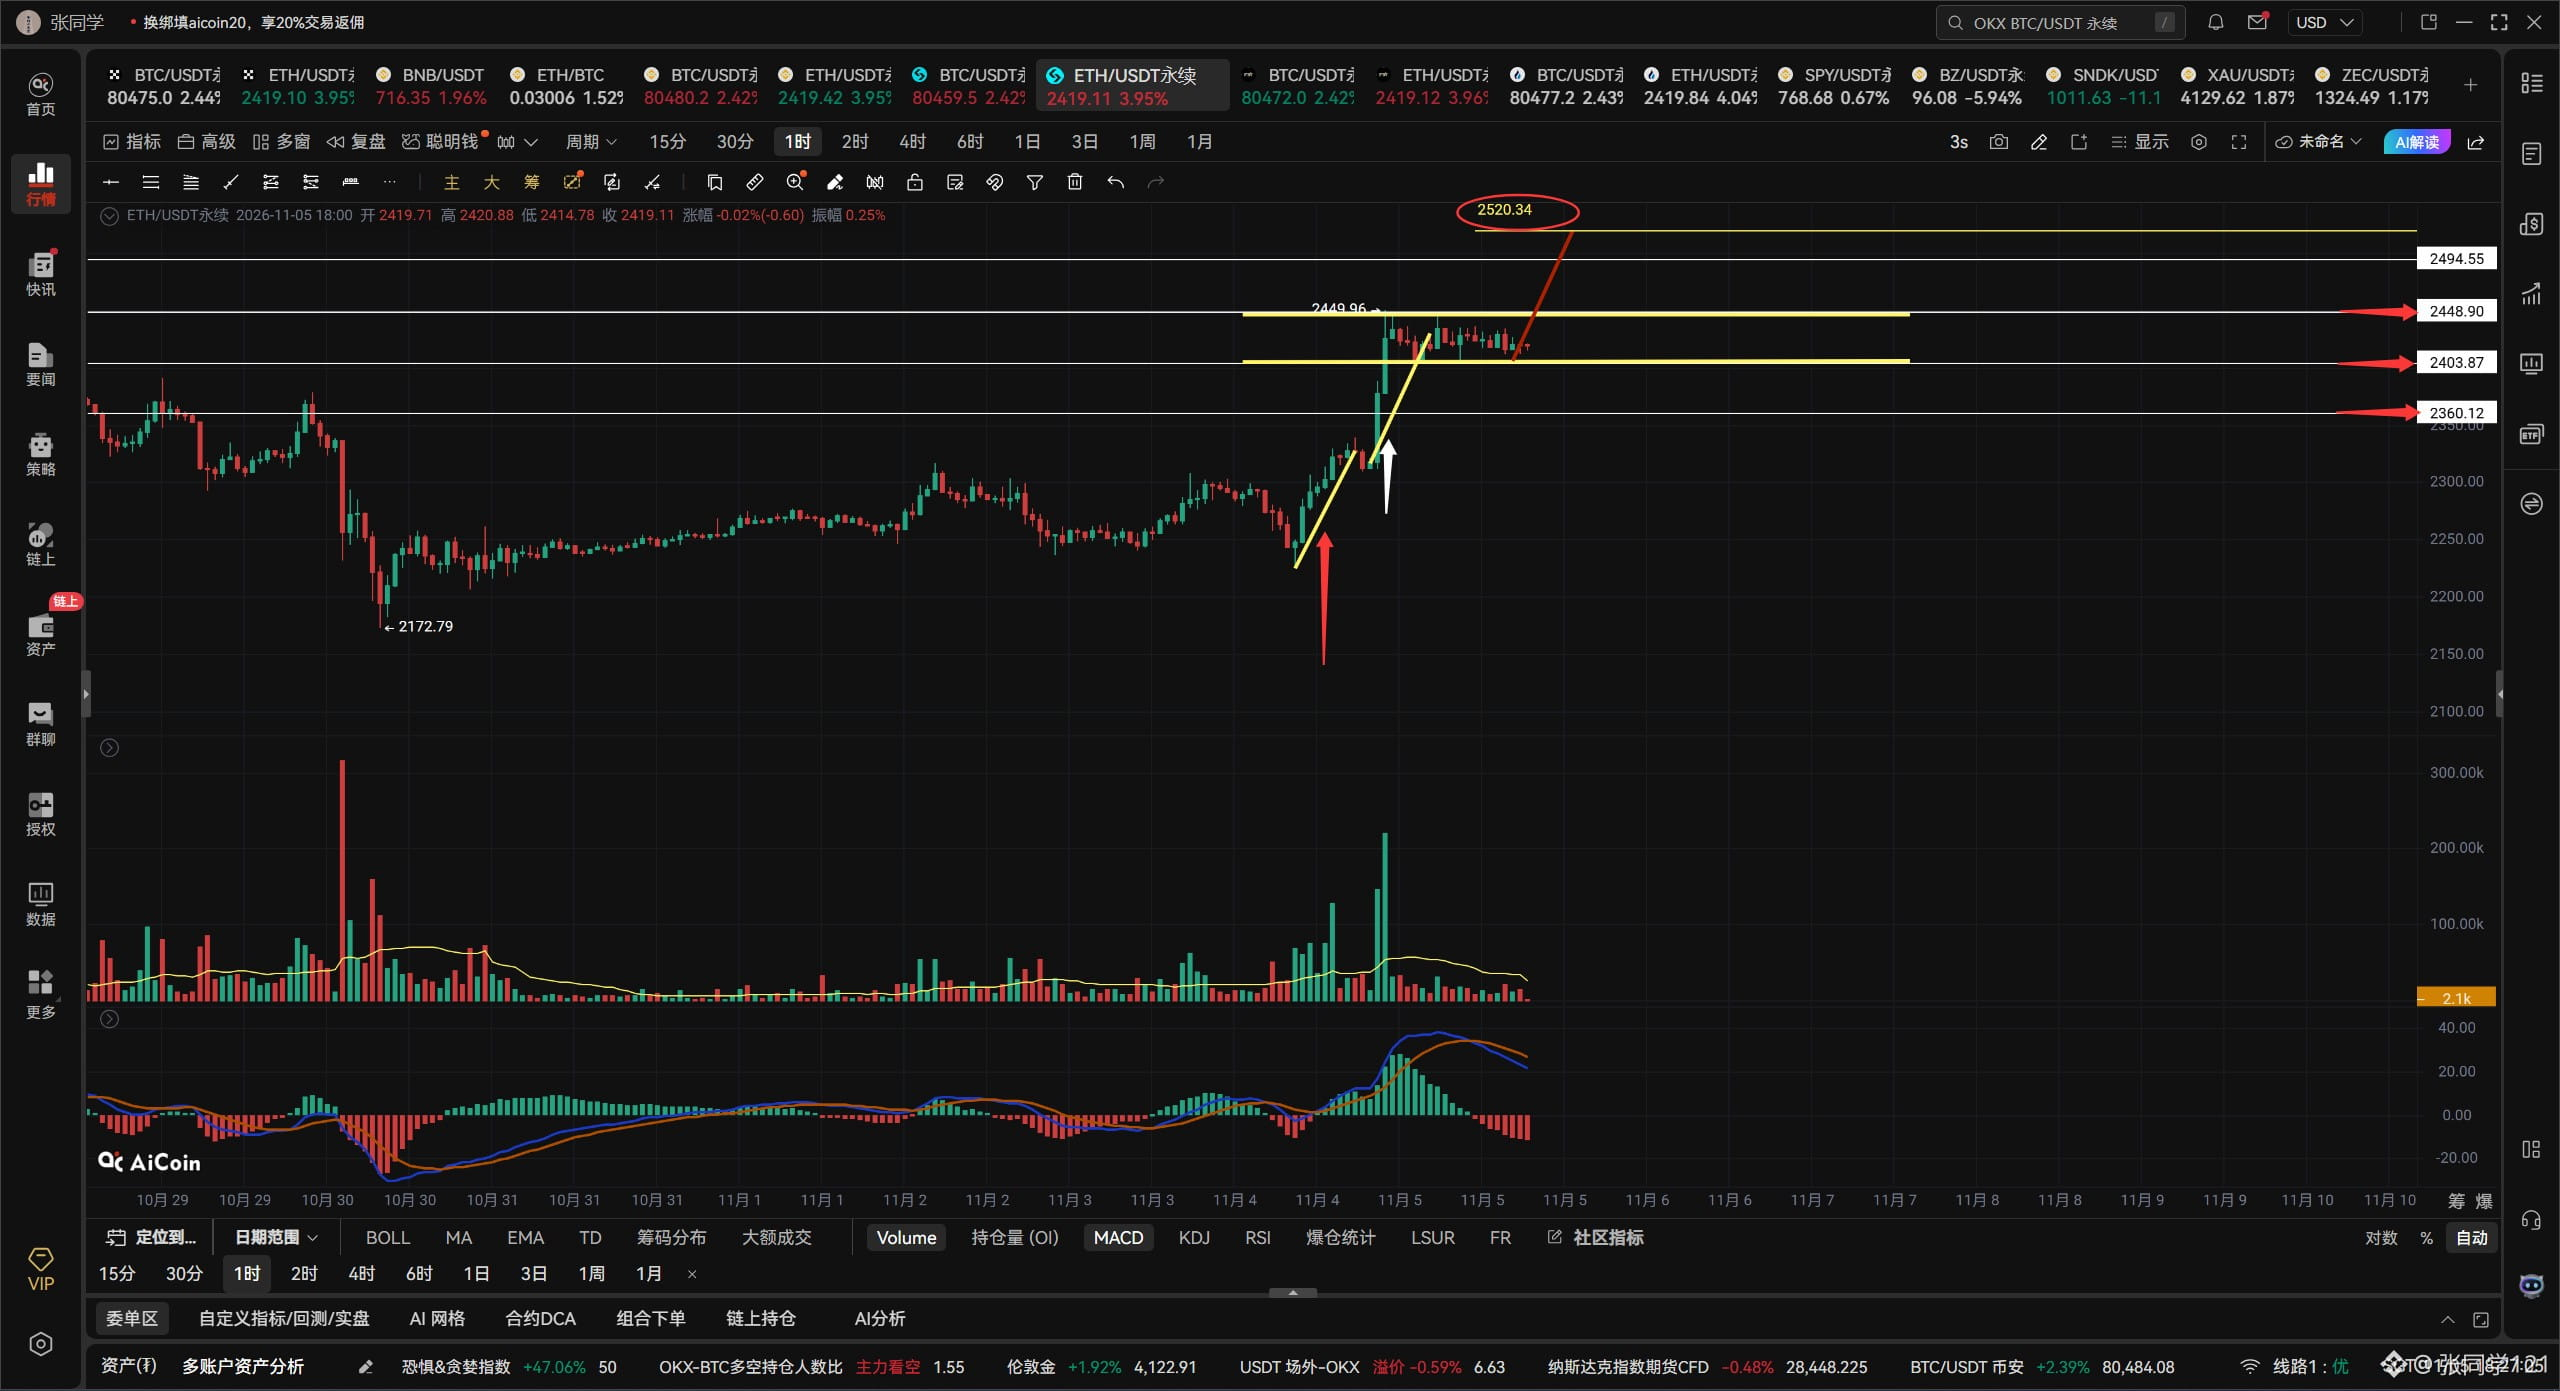
Ethereum is also moving in a consolidation range, between 2448 and 2403. Look at the yellow line segment indicated by the red arrow below. Ethereum is set to make the 1:1 rise indicated by the red arrow, and that 1:1 upward target has already been reached. Next, watch whether Ethereum’s pullback breaks below the 2403 support. As long as it holds above 2403, Ethereum should make the 1:1 rise along the yellow line segment indicated by the white arrow, with an upside target near 2520. That’s the scenario if 2403 support holds. If it breaks below 2403, it will need to retest 2360, and the 1:1 rise along the yellow line segment indicated by the white arrow will be off the table. A lot of you want to short now, right? I’d advise you not to try to pick the top. If you want to short, try to do it on the right side of the chart; picking a top on the left side can get you hurt. The more people who short, the harder it is for the price to fall. And the market has momentum—how could it surge just yesterday and then completely reverse today, unless there’s bad news? It won’t fall until the bears are pushed to despair. It’s only holding back from rising now to build up a crowd of bears, then it’ll swallow them all in one bite once there are enough.
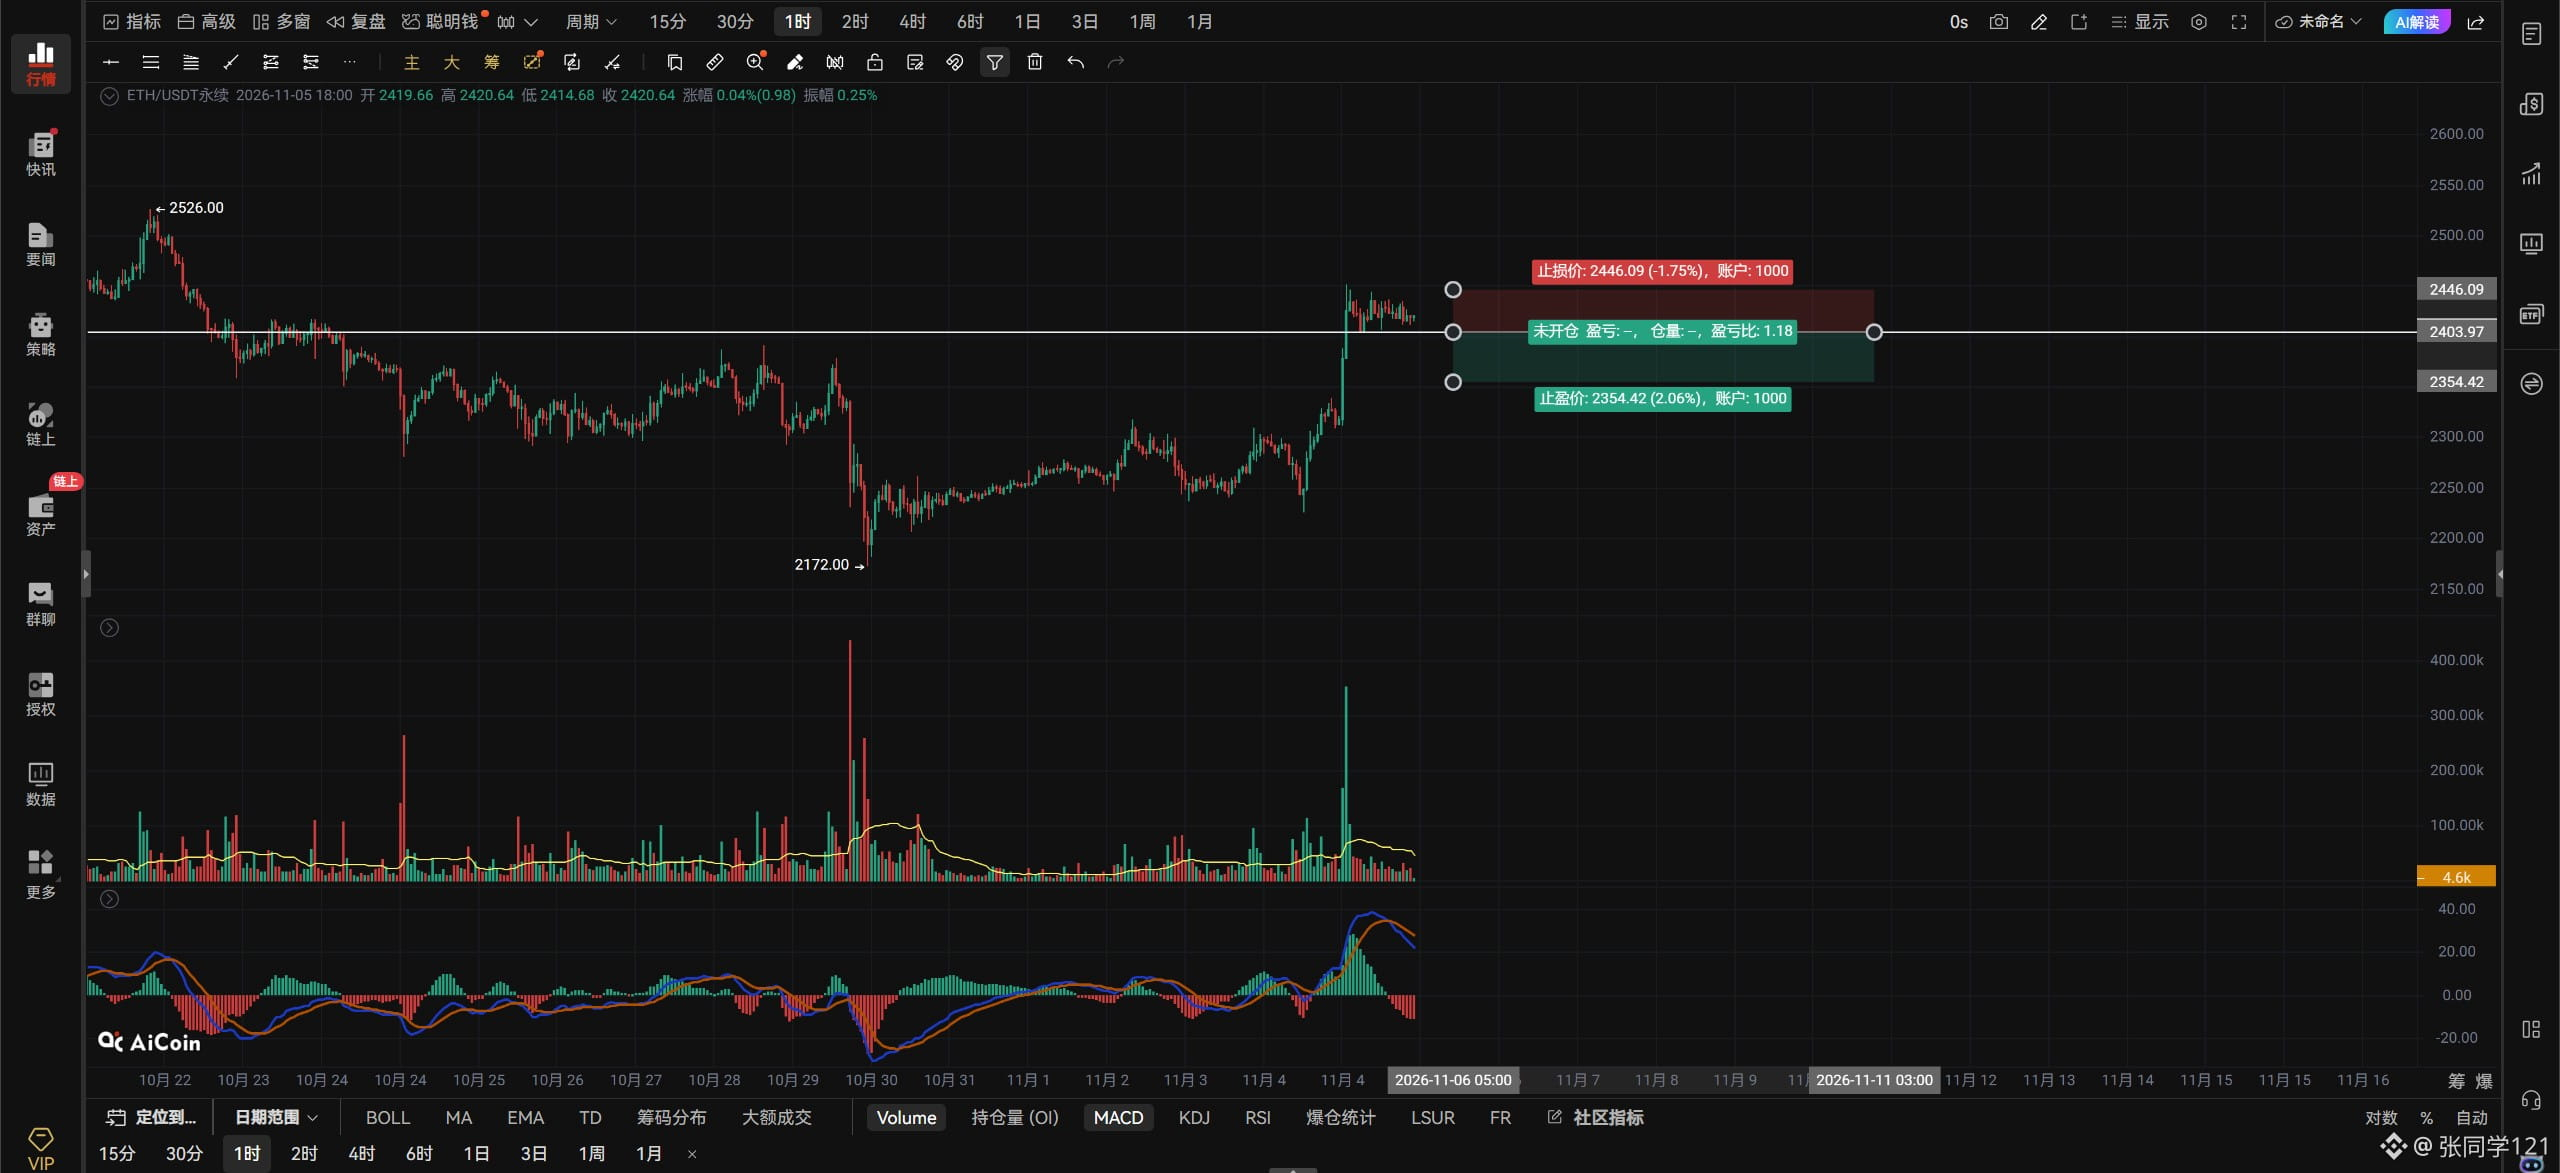
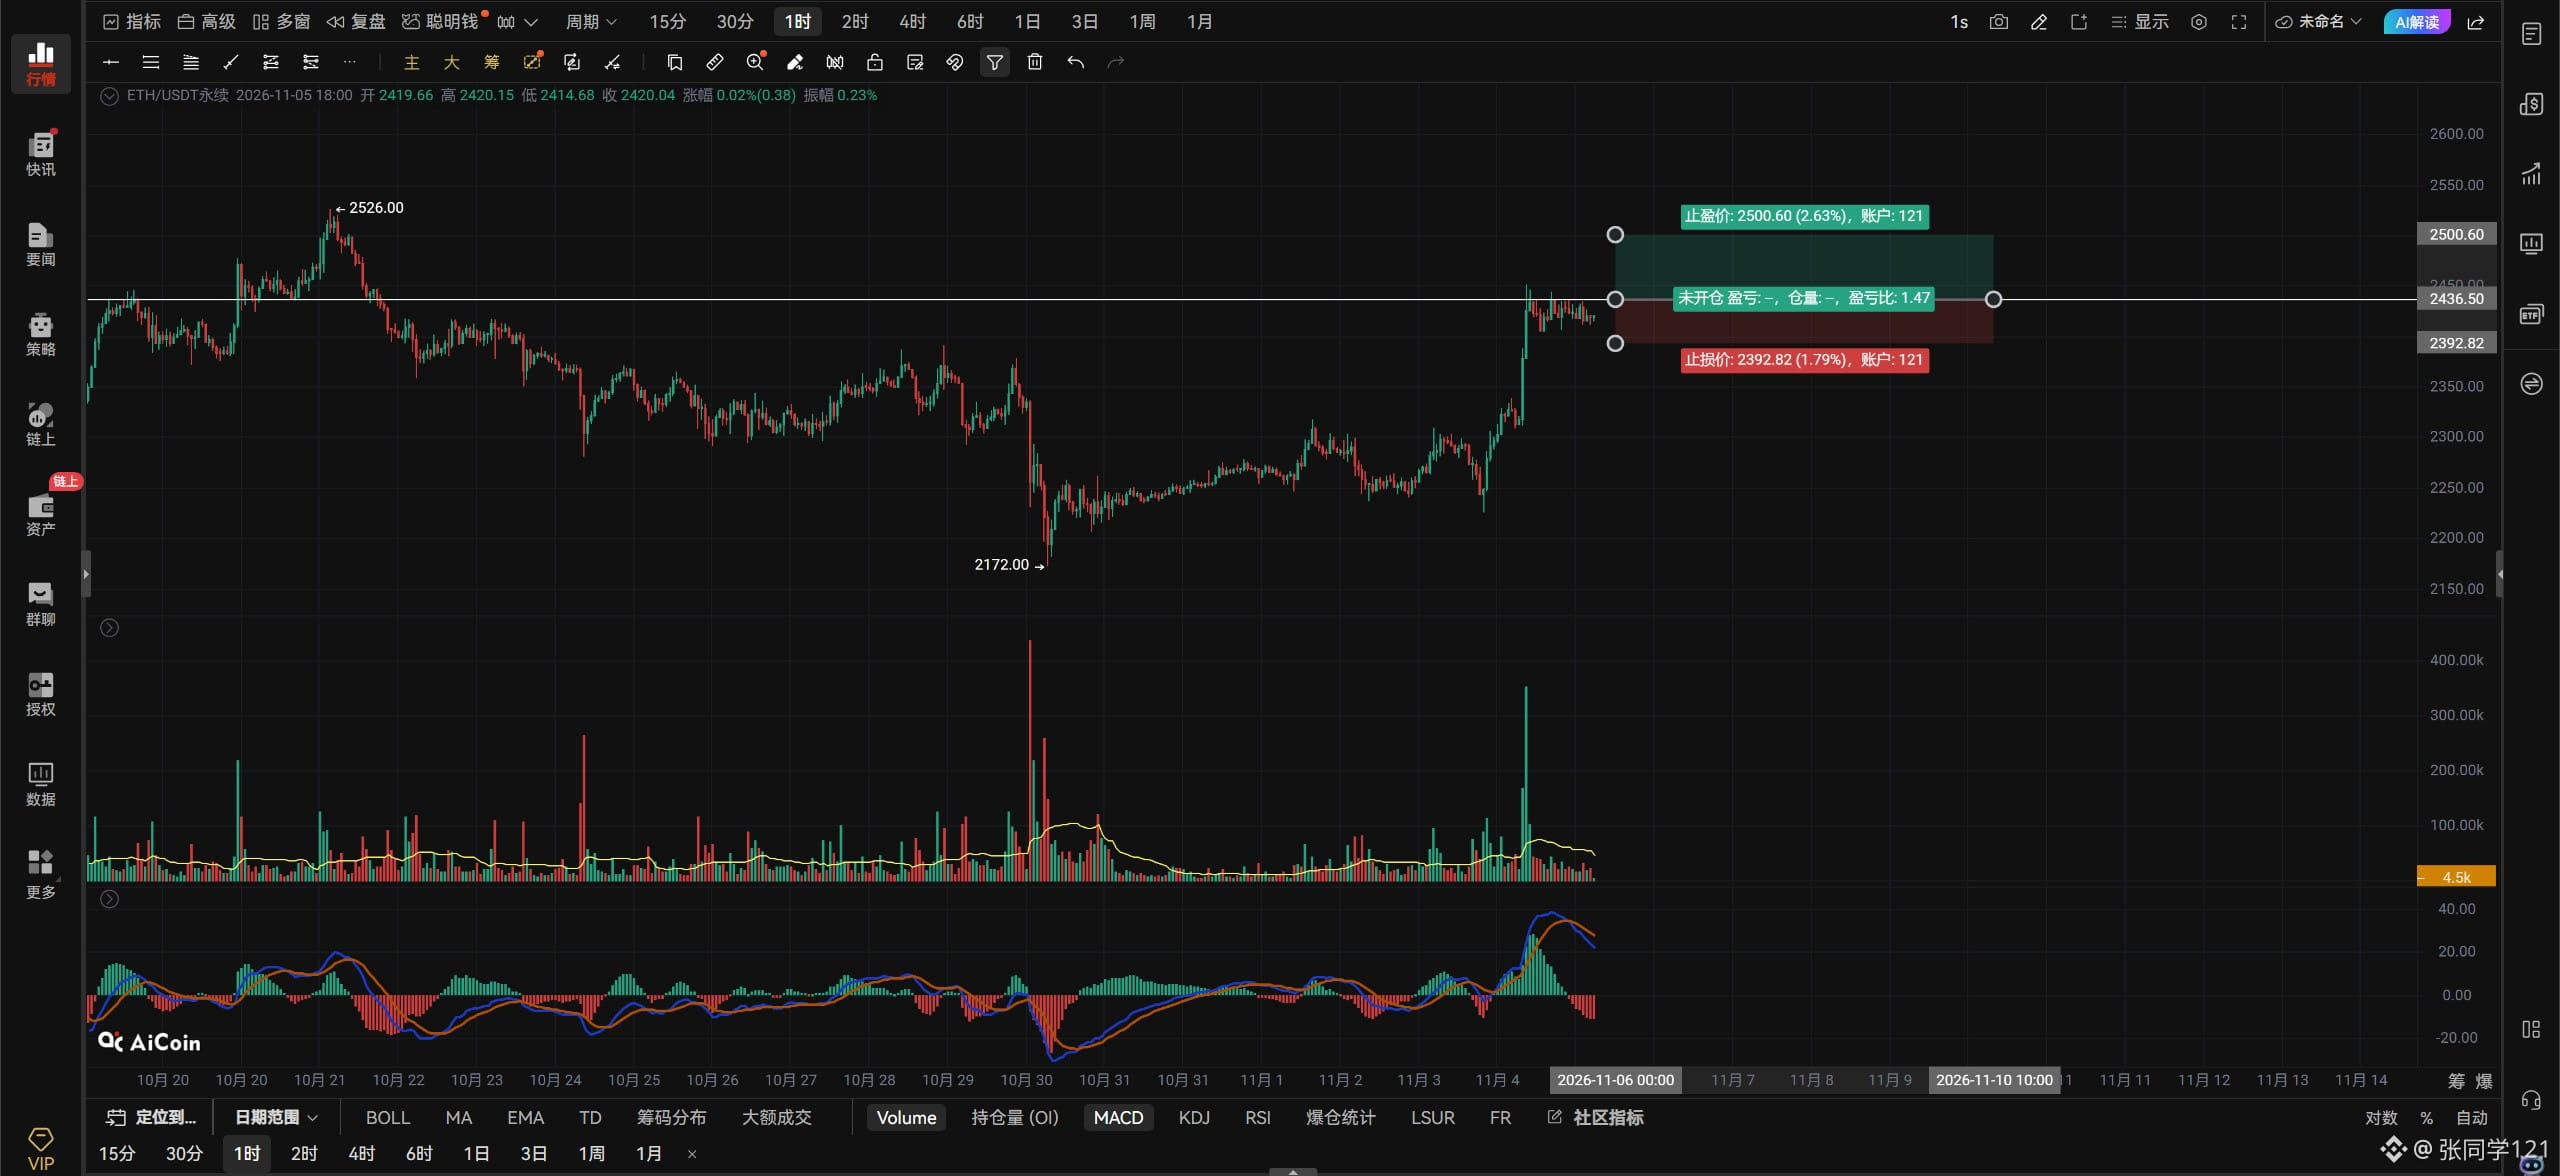
If Ethereum breaks below 2436 on strong volume, go long on the right side; if it breaks below 2403 on strong volume, go short on the right side. Watch volume changes and use stop-losses.
On the hourly chart, if Ethereum holds above 2436, look for 2479–2523.
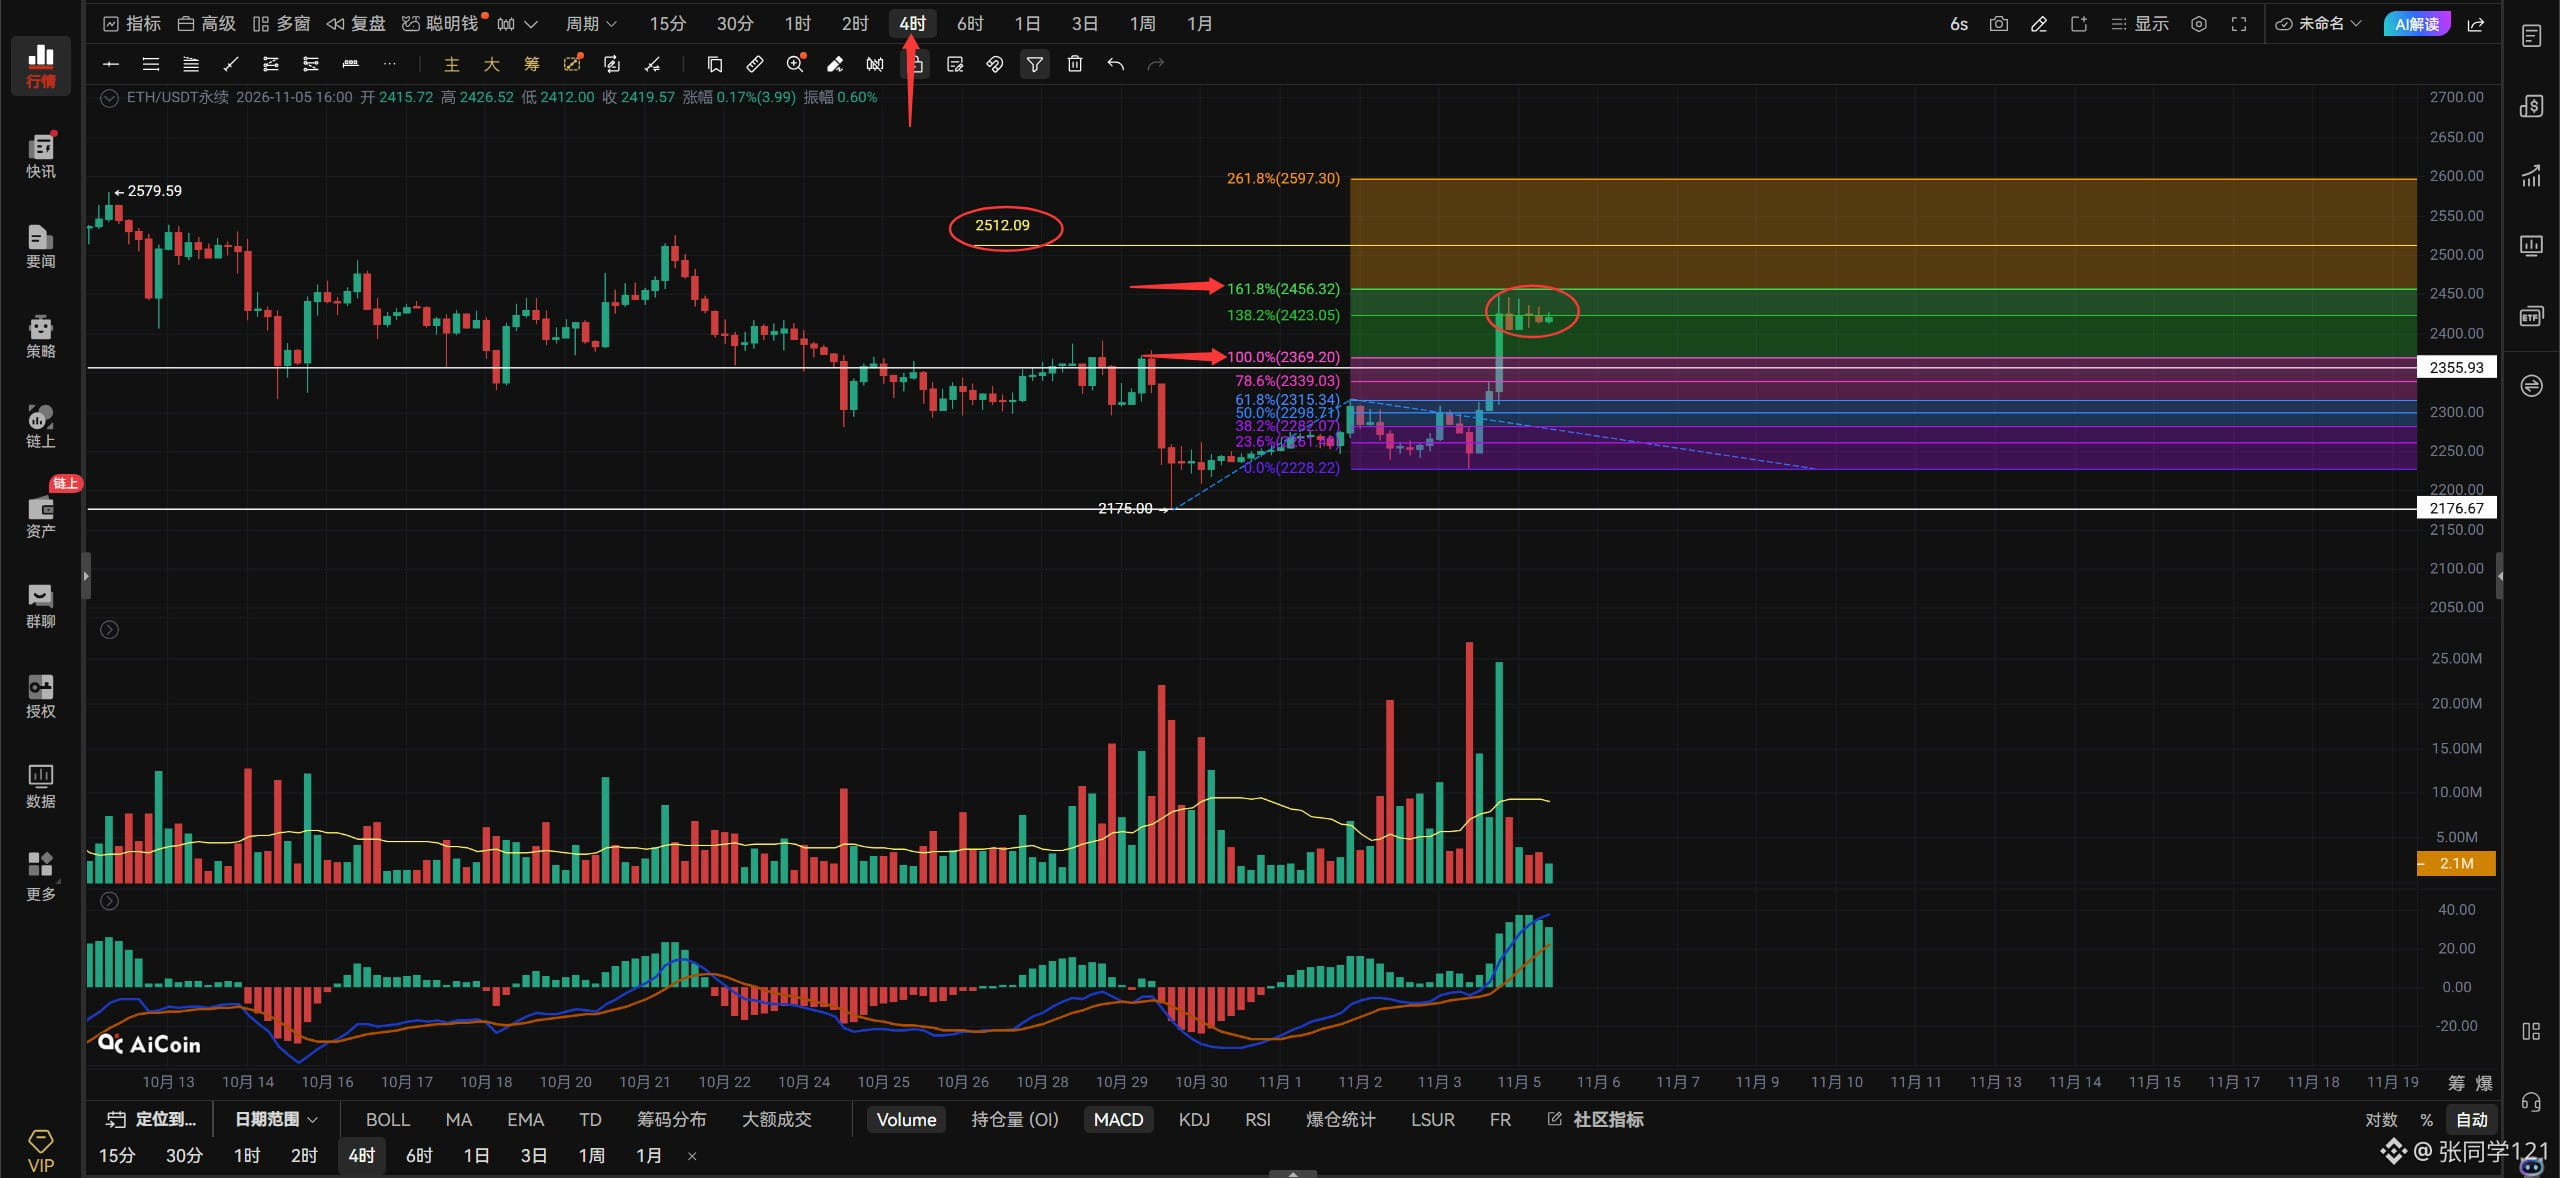
On the 4-hour chart, if it breaks below 2403, look down to 2358–2313.
Ethereum’s 4-hour 1:1 upside target at 2369 has already been reached, and price has even reached the 1.618 level. So it’s normal to see momentum stall around 2456. It’s like finishing a 10-kilometer run—you need to rest, eat, and sleep, right? The market is the same: after a big rise, it needs to rest; once it’s rested, it can keep rising. But there’s a risk point on Ethereum’s 4-hour chart: the area inside the red box. Price has wicked up there seven times without breaking through. If Ethereum gets three more chances on the 4-hour chart and still can’t break through 2456, it’ll pull back to retest the Fibonacci 1:1 upside target near 2369. If it breaks through 2456, the next 4-hour upside target is near 2512. That’s all.
$ETH
#币安将恢复更多资产提现
Ethereum is also moving in a consolidation range, between 2448 and 2403. Look at the yellow line segment indicated by the red arrow below. Ethereum is set to make the 1:1 rise indicated by the red arrow, and that 1:1 upward target has already been reached. Next, watch whether Ethereum’s pullback breaks below the 2403 support. As long as it holds above 2403, Ethereum should make the 1:1 rise along the yellow line segment indicated by the white arrow, with an upside target near 2520. That’s the scenario if 2403 support holds. If it breaks below 2403, it will need to retest 2360, and the 1:1 rise along the yellow line segment indicated by the white arrow will be off the table. A lot of you want to short now, right? I’d advise you not to try to pick the top. If you want to short, try to do it on the right side of the chart; picking a top on the left side can get you hurt. The more people who short, the harder it is for the price to fall. And the market has momentum—how could it surge just yesterday and then completely reverse today, unless there’s bad news? It won’t fall until the bears are pushed to despair. It’s only holding back from rising now to build up a crowd of bears, then it’ll swallow them all in one bite once there are enough.
If Ethereum breaks below 2436 on strong volume, go long on the right side; if it breaks below 2403 on strong volume, go short on the right side. Watch volume changes and use stop-losses.
On the hourly chart, if Ethereum holds above 2436, look for 2479–2523.
On the 4-hour chart, if it breaks below 2403, look down to 2358–2313.
Ethereum’s 4-hour 1:1 upside target at 2369 has already been reached, and price has even reached the 1.618 level. So it’s normal to see momentum stall around 2456. It’s like finishing a 10-kilometer run—you need to rest, eat, and sleep, right? The market is the same: after a big rise, it needs to rest; once it’s rested, it can keep rising. But there’s a risk point on Ethereum’s 4-hour chart: the area inside the red box. Price has wicked up there seven times without breaking through. If Ethereum gets three more chances on the 4-hour chart and still can’t break through 2456, it’ll pull back to retest the Fibonacci 1:1 upside target near 2369. If it breaks through 2456, the next 4-hour upside target is near 2512. That’s all.
$ETH
#币安将恢复更多资产提现