
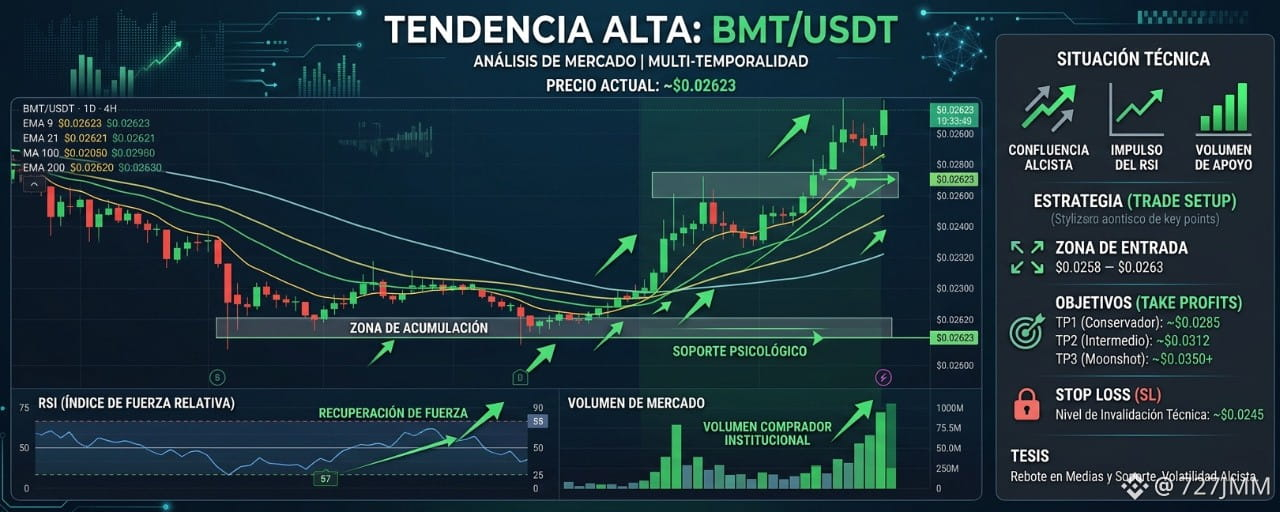


BMT/USDT is trading at $0.02623. Following a period of compression, the cross-timeframe market structure shows a clear accumulation phase preparing for a high-volatility bullish move.
Situation Analysis (Multi-Timeframe)
Daily and 4H Timeframes: The fast EMAs (9 and 21) show bullish compression just above the MA 50, aiming for a golden cross with the MA 100. The structure remains at macro support.
15m / 5m Timeframes: Price respects the 200 EMA on the 15-minute chart with surgical precision. The RSI is recovering from the 42 zone toward the midpoint (50–55), signaling a hidden bullish divergence that confirms sellers are losing strength. Volume shows a contraction pattern followed by institutional buying volume bars.
Trade Setup
Ideal Entry Zone: $0.02580 – $0.02630 (Retest range and psychological support).
TP1 (Conservative): $0.02850 (Local resistance / Fibonacci 0.382 retracement).
TP2 (Intermediate): $0.03120 (Institutional liquidity block and Fibonacci 0.618).
TP3 (Moonshot): $0.03500+ (Bullish impulse extension toward session highs).
Stop Loss (SL): $0.02450 (Strict technical invalidation level below structural support and the 200 EMA on the 15m chart). Risk management is mandatory.
Trade Range and Market Thesis
We are entering this zone by taking advantage of a technical bounce confirmed by the confluence of the 200 EMA and psychological support at $0.026. The RSI is emerging from the bearish exhaustion zone, supported by volume in the order book. The distribution phase has ended, and the market is entering a controlled bullish impulse.
Manage your risk appropriately and stay disciplined.