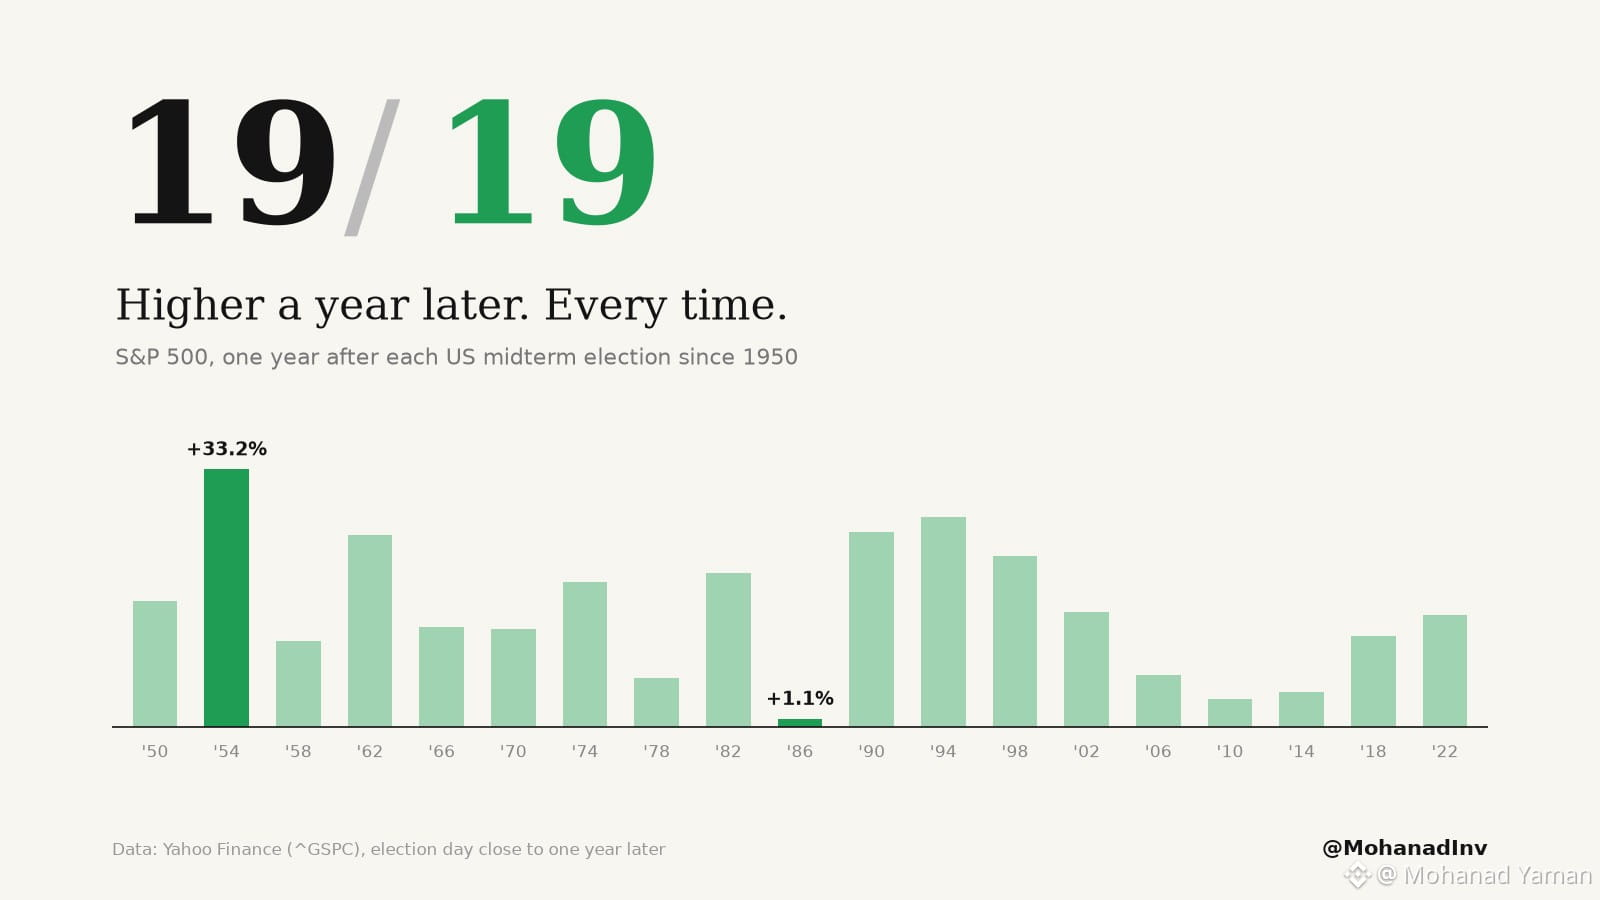
🗳️ 19 midterms since 1950. S&P 500 one year after Election Day: higher all 19 times.
📈 Average 15.1%. Median 14.5%.
Best 33.2% (1954). Worst 1.1% (1986, the window that caught the 1987 crash).
⚠️ 13 of those 19 midterm years saw a 10% drop along the way. 2026's deepest pullback so far: 9.1%.
20 for 20, or is this the year the streak breaks?
#stocks
📈 Average 15.1%. Median 14.5%.
Best 33.2% (1954). Worst 1.1% (1986, the window that caught the 1987 crash).
⚠️ 13 of those 19 midterm years saw a 10% drop along the way. 2026's deepest pullback so far: 9.1%.
20 for 20, or is this the year the streak breaks?
#stocks