
黑猫SabTheTrader
890 Posts

黑猫SabTheTrader
Report
Block User
👩💻4 Years NQ & Crypto Female Trader | Price action has the final say | X: SabTheTrader | 直播时间:周一至周五,晚10点-12点 | 币安现货合约8折邀请码: SAB111

HYPE Holder
High-Frequency Trader
6.7 Years
222 Following
17.8K+ Followers
5.5K+ Liked
Posts
All
Quotes
Videos
Live
PINNED
30D trade $BTC 2.6K USDT
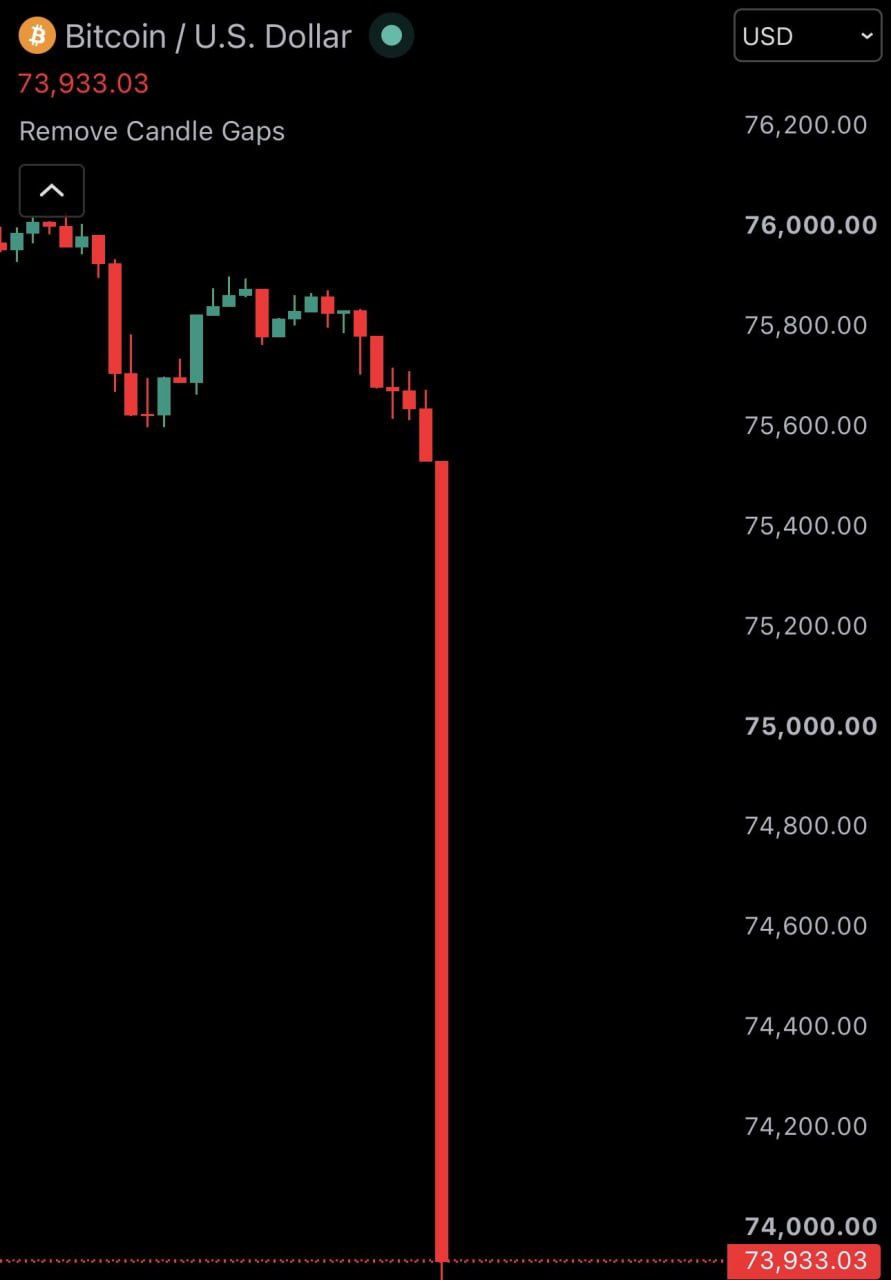
#加密市场24小时清算达11.6亿美元 🔴 Crypto market liquidations near $1.16 billion in 24 hours! $BTC Is fear continuing to spread? 👀
BTC has closed lower for 5 consecutive weeks, and market sentiment remains subdued.
Today, the Fear & Greed Index fell to 28 (Fear), while crypto market liquidations over the past 24 hours reached approximately $1.16 billion.
BTC is currently trading at around $74,612, as the market undergoes a sharp deleveraging.
It’s worth noting that a low Fear Index doesn’t mean the market has bottomed. After a large number of leveraged positions are liquidated, short-term selling pressure may ease somewhat. But without sustained spot buying, prices may continue searching for support.
Next, watch whether BTC can hold around $74,000 and whether market sentiment begins to recover.
📊 Do you think BTC will rebound amid the panic, or continue to fall?
🟢 YES — A rebound after the panic!
🔴 NO — The downtrend isn’t over yet!
* NFA, DYOR
#比特币连续五周下跌
{future}(BTCUSDT)
#加密市场24小时清算达11.6亿美元 🔴 Crypto market liquidations near $1.16 billion in 24 hours! $BTC Is fear continuing to spread? 👀
BTC has closed lower for 5 consecutive weeks, and market sentiment remains subdued.
Today, the Fear & Greed Index fell to 28 (Fear), while crypto market liquidations over the past 24 hours reached approximately $1.16 billion.
BTC is currently trading at around $74,612, as the market undergoes a sharp deleveraging.
It’s worth noting that a low Fear Index doesn’t mean the market has bottomed. After a large number of leveraged positions are liquidated, short-term selling pressure may ease somewhat. But without sustained spot buying, prices may continue searching for support.
Next, watch whether BTC can hold around $74,000 and whether market sentiment begins to recover.
📊 Do you think BTC will rebound amid the panic, or continue to fall?
🟢 YES — A rebound after the panic!
🔴 NO — The downtrend isn’t over yet!
* NFA, DYOR
#比特币连续五周下跌
BTC has closed lower for 5 consecutive weeks, and market sentiment remains subdued.
Today, the Fear & Greed Index fell to 28 (Fear), while crypto market liquidations over the past 24 hours reached approximately $1.16 billion.
BTC is currently trading at around $74,612, as the market undergoes a sharp deleveraging.
It’s worth noting that a low Fear Index doesn’t mean the market has bottomed. After a large number of leveraged positions are liquidated, short-term selling pressure may ease somewhat. But without sustained spot buying, prices may continue searching for support.
Next, watch whether BTC can hold around $74,000 and whether market sentiment begins to recover.
📊 Do you think BTC will rebound amid the panic, or continue to fall?
🟢 YES — A rebound after the panic!
🔴 NO — The downtrend isn’t over yet!
* NFA, DYOR
#比特币连续五周下跌

2.3k
21
148
2.3k
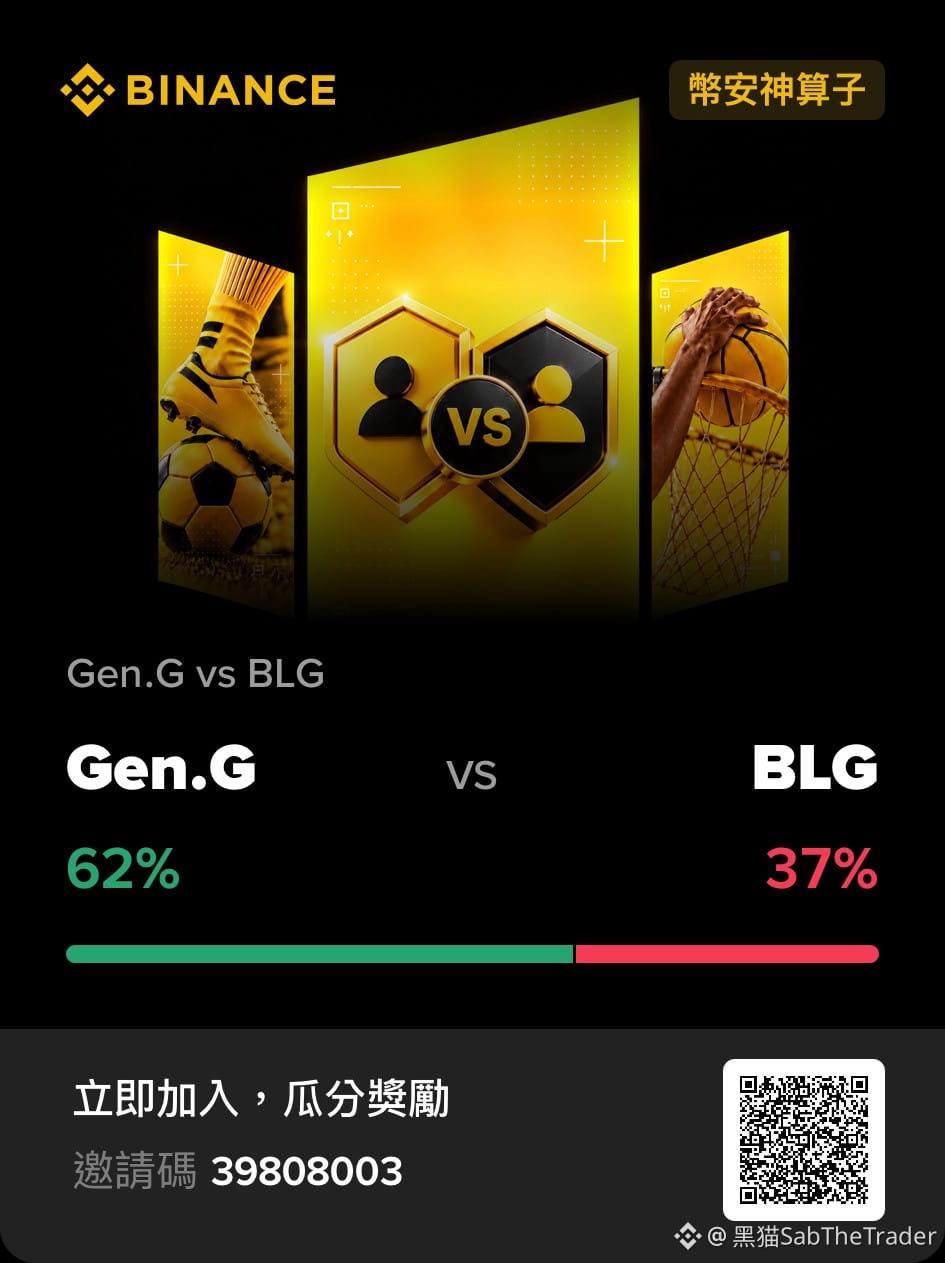
#BinancePick Keep checking in, keep checking in! Will Gen.G or BLG win? It's the last week, wahaha!
#BinancePick Keep checking in, keep checking in! Will Gen.G or BLG win? It's the last week, wahaha!
1
182


金猫1688
·
--
Click through to $FIRECAT
Redeem $FIRECAT 🔥Fire Alarm Cat🐱
It's rising again 📈📈📈
Join the 🔥Fire Alarm Cat🐱 livestream at 20:00,
for a chance to win prizes for answering first 💰💰💰💰💰💰💰💰💰
Redeem $FIRECAT 🔥Fire Alarm Cat🐱
It's rising again 📈📈📈
Join the 🔥Fire Alarm Cat🐱 livestream at 20:00,
for a chance to win prizes for answering first 💰💰💰💰💰💰💰💰💰

246

阿婧1688
·
--
The sister-in-law is here—we’ve won an award! The bigger the storm, the more expensive the fish! 🌹💰🎉
$SOL
$SOL


2
809

奋斗Hustle1688
·
--
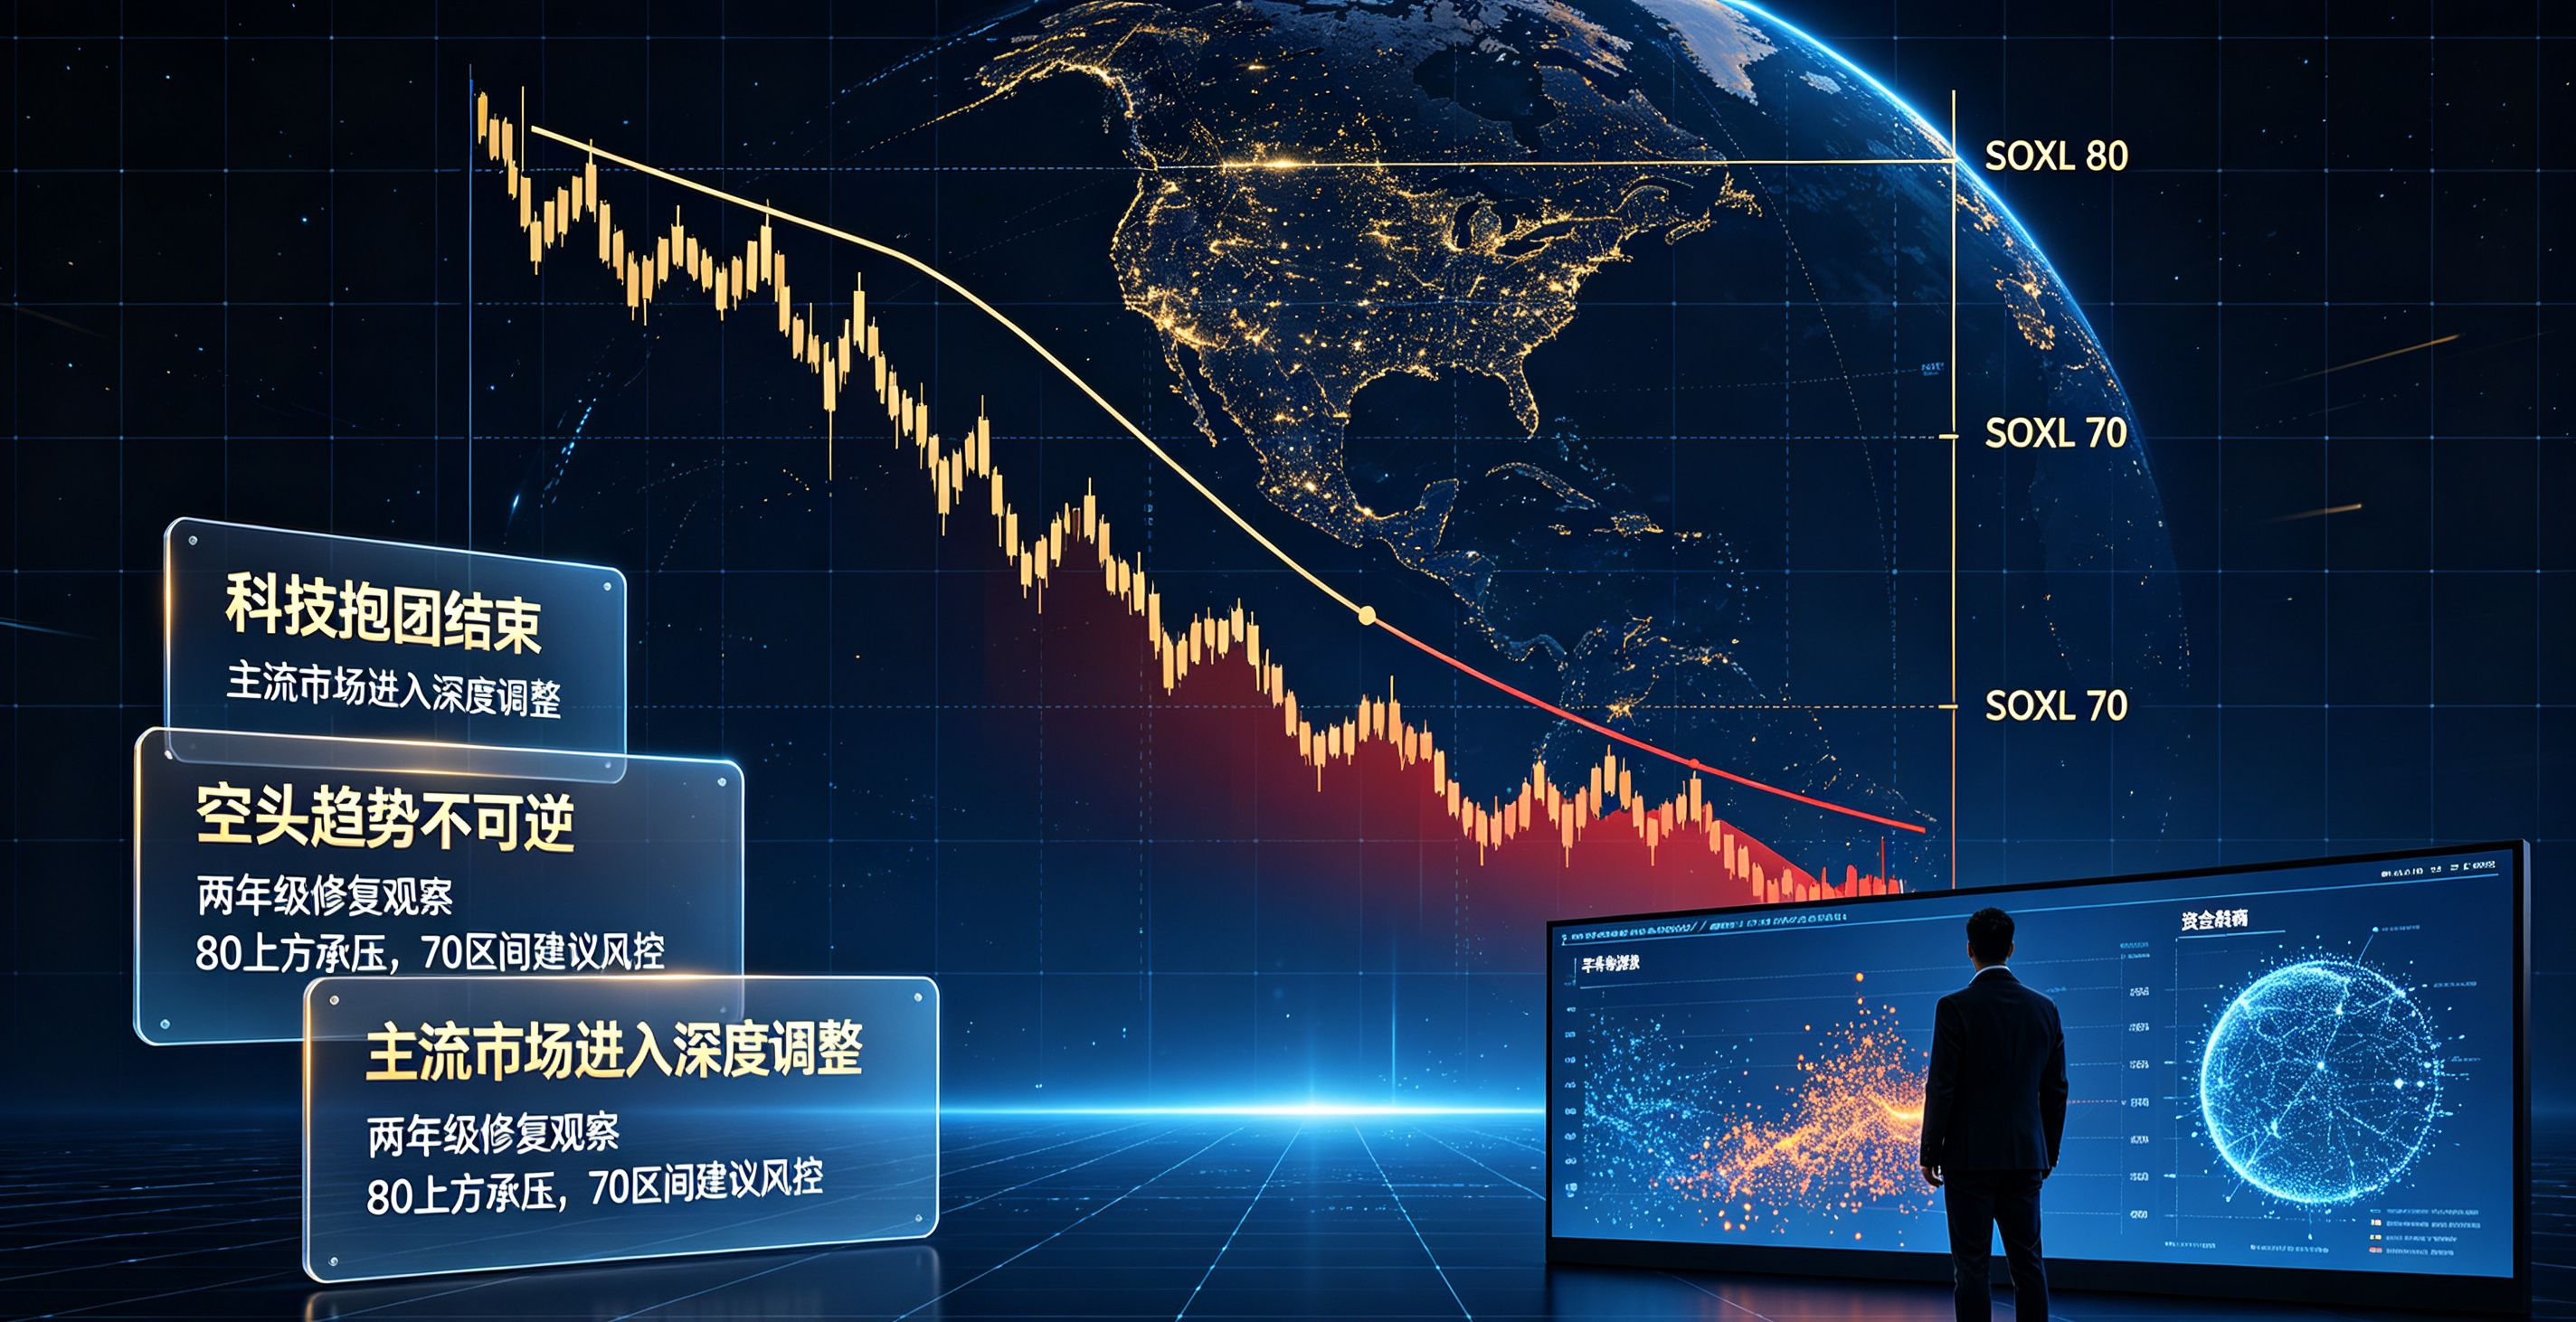
The broader market has turned completely bearish this time, and it’ll probably take at least two years to recover. Don’t count on a bull market. Even two years from now, it’ll depend on whether U.S. stocks can bounce back. Just keep an eye on the semiconductor ETF ( $SOXL ). If it can hold above $80, there may still be a chance—but I’m not optimistic. The overall trend is already heading down, and it’ll be hard to turn around. If you’re still stubbornly holding above $80, get out quickly if it drops back into the $70s. Holding on will only mean bigger losses. Bottom line: the boom in U.S. tech stocks is completely over.
317

北辰1688
·
--
Bullish#币安神算子 Good morning, a sunny day is beginning. Follow, share, and claim 🧧🧧🧧$BNB

305
奋斗Hustle1688
·
--
[Replay] 🎙️ Continue building BNB
02 h 39 m 09 s · 7.5k listens
310

🧧🔥🎁✨
🧧🔥🎁✨
黑猫SabTheTrader
·
--
#加密市场24小时清算达11.6亿美元 🔴 Crypto market liquidations near $1.16 billion in 24 hours! $BTC Is fear continuing to spread? 👀
BTC has closed lower for 5 consecutive weeks, and market sentiment remains subdued.
Today, the Fear & Greed Index fell to 28 (Fear), while crypto market liquidations over the past 24 hours reached approximately $1.16 billion.
BTC is currently trading at around $74,612, as the market undergoes a sharp deleveraging.
It’s worth noting that a low Fear Index doesn’t mean the market has bottomed. After a large number of leveraged positions are liquidated, short-term selling pressure may ease somewhat. But without sustained spot buying, prices may continue searching for support.
Next, watch whether BTC can hold around $74,000 and whether market sentiment begins to recover.
📊 Do you think BTC will rebound amid the panic, or continue to fall?
🟢 YES — A rebound after the panic!
🔴 NO — The downtrend isn’t over yet!
* NFA, DYOR
#比特币连续五周下跌
BTC has closed lower for 5 consecutive weeks, and market sentiment remains subdued.
Today, the Fear & Greed Index fell to 28 (Fear), while crypto market liquidations over the past 24 hours reached approximately $1.16 billion.
BTC is currently trading at around $74,612, as the market undergoes a sharp deleveraging.
It’s worth noting that a low Fear Index doesn’t mean the market has bottomed. After a large number of leveraged positions are liquidated, short-term selling pressure may ease somewhat. But without sustained spot buying, prices may continue searching for support.
Next, watch whether BTC can hold around $74,000 and whether market sentiment begins to recover.
📊 Do you think BTC will rebound amid the panic, or continue to fall?
🟢 YES — A rebound after the panic!
🔴 NO — The downtrend isn’t over yet!
* NFA, DYOR
#比特币连续五周下跌

1
235

CJ_W
·
--
🧧🧧🧧🧧
🎁🎁🎁🎁
#新人宝典:从零了解TradFi
$SPCXB
🎁🎁🎁🎁
#新人宝典:从零了解TradFi
$SPCXB
1
201
CJ_GraceWang1688
·
--
🧧🧧🧧
#比特币连续五周下跌
$BTC Up? Down?
#比特币连续五周下跌
$BTC Up? Down?
2
478
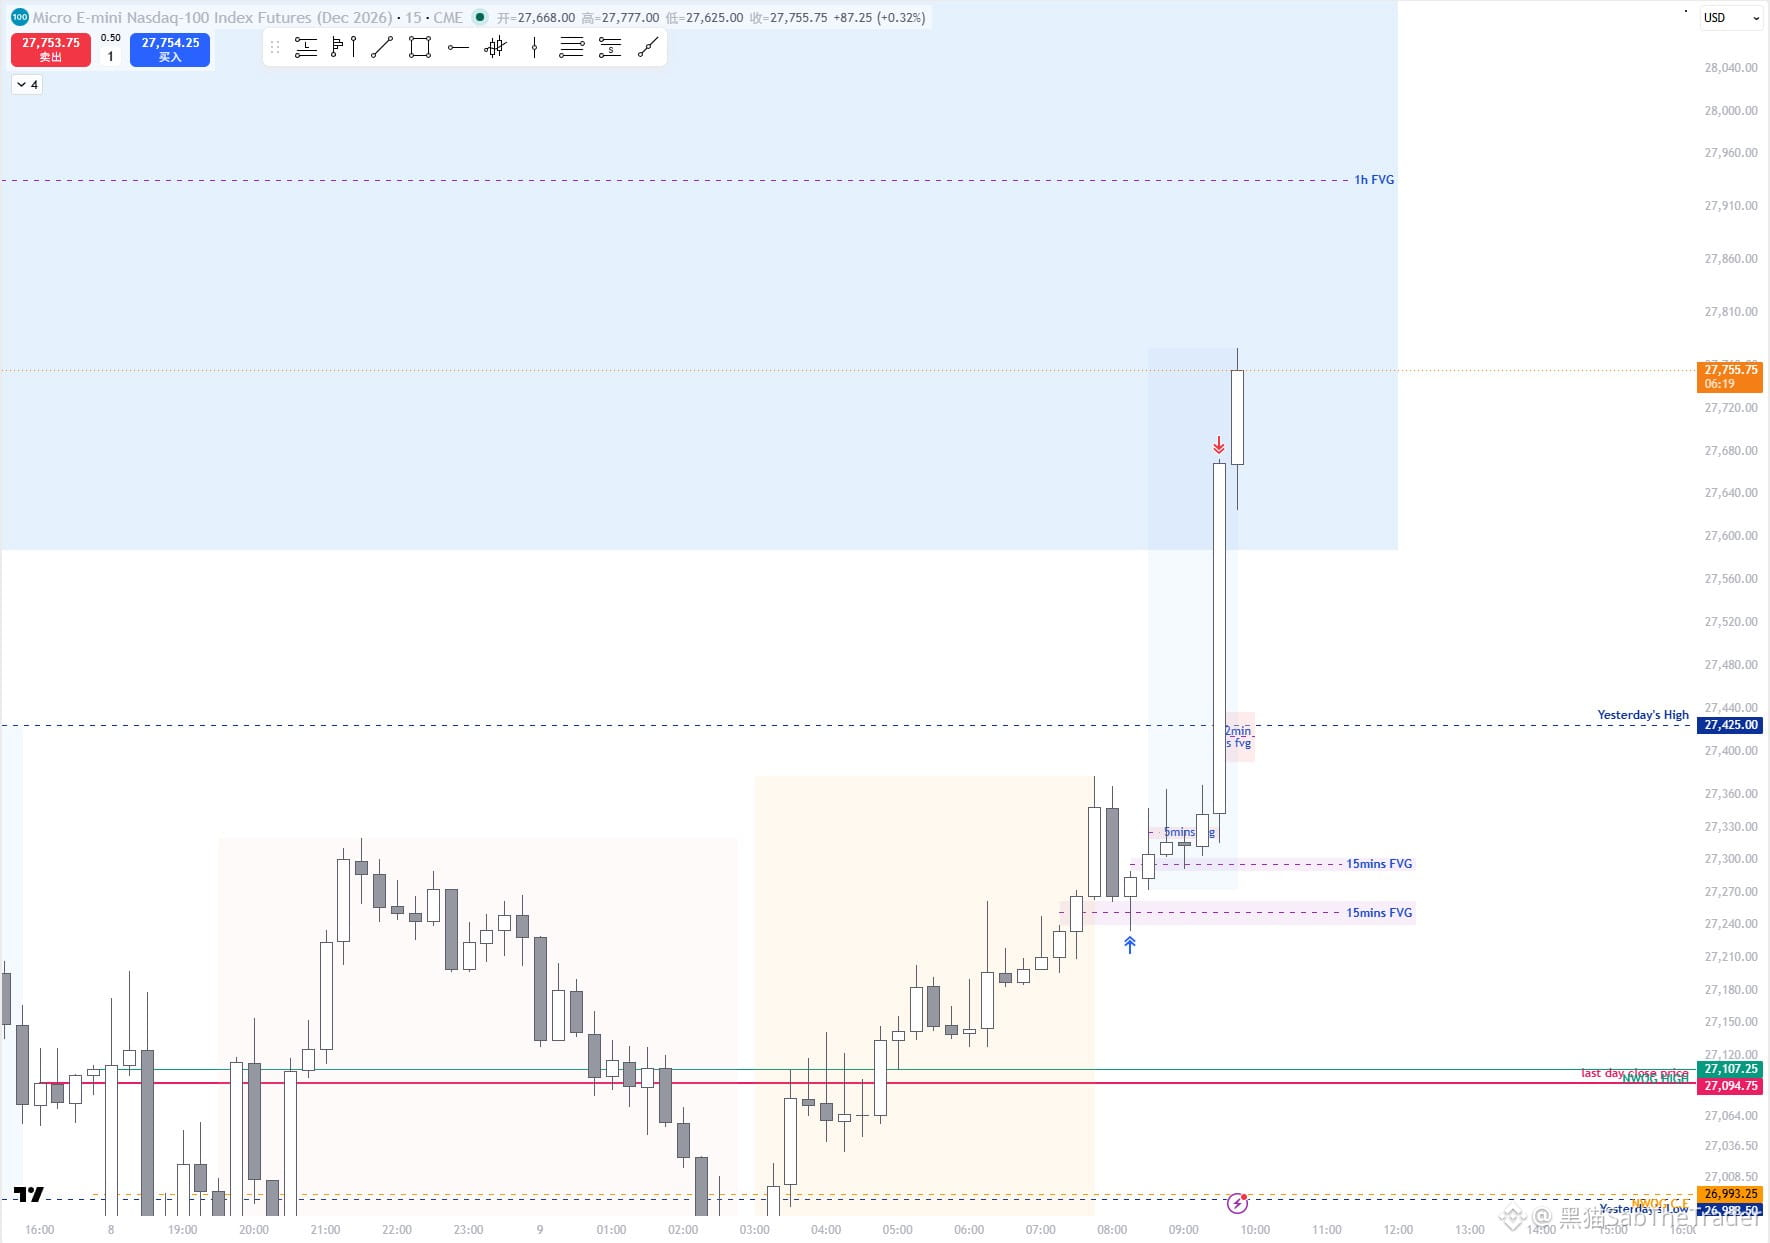
Today, $QQQ hit take-profit at 300 points. Entry time: 20:15, exit time: 21:40
Holding time: 1 hour and 25 minutes.
So I ended the stream early. Grateful (●'◡'●)
Today, $QQQ hit take-profit at 300 points. Entry time: 20:15, exit time: 21:40
Holding time: 1 hour and 25 minutes.
So I ended the stream early. Grateful (●'◡'●)
Holding time: 1 hour and 25 minutes.
So I ended the stream early. Grateful (●'◡'●)
黑猫SabTheTrader
·
--
[Replay] 🔴 CPI WEEK! The Nasdaq has been under sustained pressure—can it stop falling and rebound tonight?
41 m 25 s · 184 views
2
642
30D trade $BTC 2.6K USDT
#比特币连续五周下跌 $BTC Down for 5 consecutive weeks! Will week 6 bring a rebound? 👀
Bitcoin’s weekly chart has officially closed its 5th consecutive red candle!
Over the past 5 weeks, BTC has fallen from around $86,530 to $74,851, a cumulative drop of about 13.5%. Last week’s decline alone reached 4.5%, the biggest weekly drop in this downturn.
Meanwhile, U.S. spot BTC ETFs saw net outflows of around $1.28 billion last week, with funds continuing to flow out and market sentiment remaining subdued.
The $73,000–$75,000 range is worth watching next. If buyers can hold this area and push the price back above $75,500, a short-term technical rebound may be possible. But if support fails, downward pressure could intensify further.
📊 After 5 consecutive weeks of losses, where do you think BTC is headed this week?
🟢 YES — The losing streak ends, and a rebound is on the way!
🔴 NO — The decline continues as BTC looks for lower support!
* NFA, DYOR
{future}(BTCUSDT)
#比特币连续五周下跌 $BTC Down for 5 consecutive weeks! Will week 6 bring a rebound? 👀
Bitcoin’s weekly chart has officially closed its 5th consecutive red candle!
Over the past 5 weeks, BTC has fallen from around $86,530 to $74,851, a cumulative drop of about 13.5%. Last week’s decline alone reached 4.5%, the biggest weekly drop in this downturn.
Meanwhile, U.S. spot BTC ETFs saw net outflows of around $1.28 billion last week, with funds continuing to flow out and market sentiment remaining subdued.
The $73,000–$75,000 range is worth watching next. If buyers can hold this area and push the price back above $75,500, a short-term technical rebound may be possible. But if support fails, downward pressure could intensify further.
📊 After 5 consecutive weeks of losses, where do you think BTC is headed this week?
🟢 YES — The losing streak ends, and a rebound is on the way!
🔴 NO — The decline continues as BTC looks for lower support!
* NFA, DYOR
Bitcoin’s weekly chart has officially closed its 5th consecutive red candle!
Over the past 5 weeks, BTC has fallen from around $86,530 to $74,851, a cumulative drop of about 13.5%. Last week’s decline alone reached 4.5%, the biggest weekly drop in this downturn.
Meanwhile, U.S. spot BTC ETFs saw net outflows of around $1.28 billion last week, with funds continuing to flow out and market sentiment remaining subdued.
The $73,000–$75,000 range is worth watching next. If buyers can hold this area and push the price back above $75,500, a short-term technical rebound may be possible. But if support fails, downward pressure could intensify further.
📊 After 5 consecutive weeks of losses, where do you think BTC is headed this week?
🟢 YES — The losing streak ends, and a rebound is on the way!
🔴 NO — The decline continues as BTC looks for lower support!
* NFA, DYOR
2.3k
6
113
2.3k
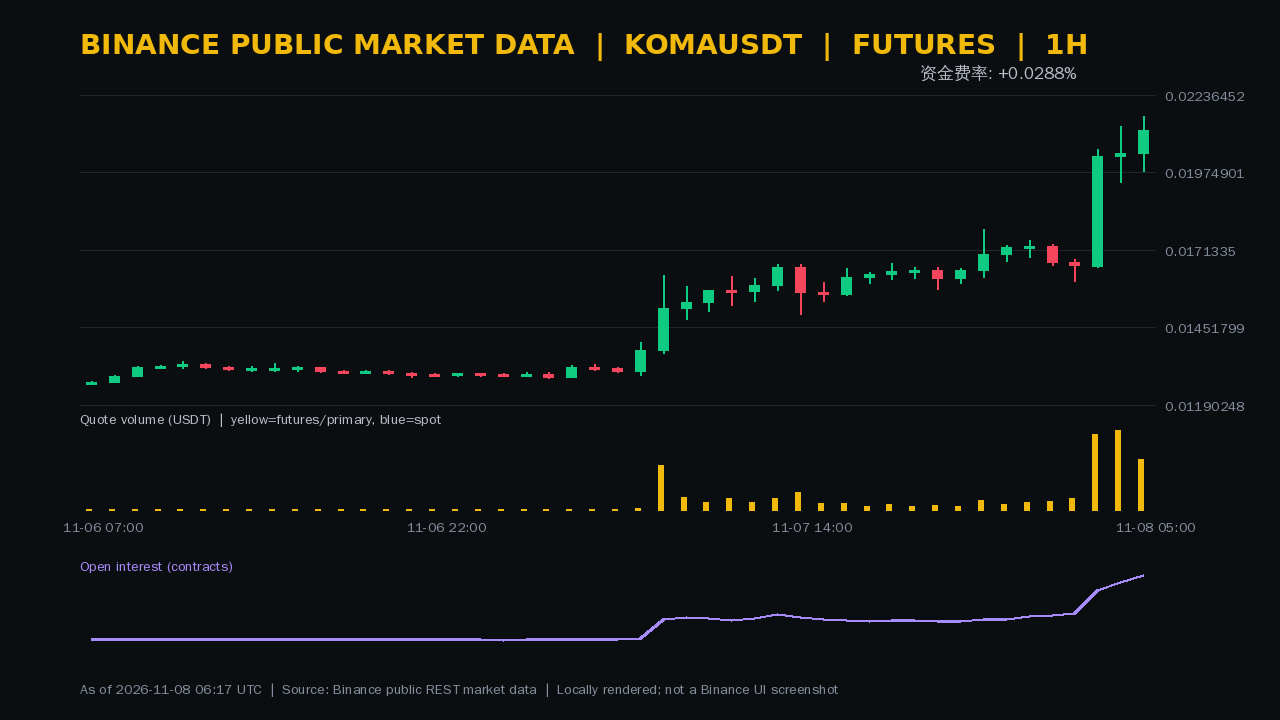
Up 60.76% in 24 hours, with a further 26.61% gain over the last 4 complete hours; trading volume has expanded to 7.09 times that of the previous window. $KOMA is accelerating in volume and price, alongside a 57.18% expansion in quantity OI over a 30-point window.
The latest complete 1-hour period saw a 3.72% gain and a 4.35% increase in OI, while trading volume fell 36.49% from the prior period. Momentum remains, but marginal trading activity has cooled; the indicative funding rate is about +0.0288%, while the latest actual settlement was about +0.1155%, raising the cost of holding long positions.
KOMA currently lacks cross-confirmation from Binance spot, and quantity OI cannot identify whether new positions are net long or short. The simultaneous expansion of volume, price, and open interest does not prove the rally will necessarily continue, and higher funding rates could amplify a pullback through leverage.
The trend will gain fresh confirmation only if a complete hourly candle breaks above 0.021643 USDT on rising volume while OI growth remains moderate. If it falls below 0.019779 USDT on rising volume accompanied by contracting OI, I would prioritize guarding against high-level deleveraging.
* NFA, DYOR
Up 60.76% in 24 hours, with a further 26.61% gain over the last 4 complete hours; trading volume has expanded to 7.09 times that of the previous window. $KOMA is accelerating in volume and price, alongside a 57.18% expansion in quantity OI over a 30-point window.
The latest complete 1-hour period saw a 3.72% gain and a 4.35% increase in OI, while trading volume fell 36.49% from the prior period. Momentum remains, but marginal trading activity has cooled; the indicative funding rate is about +0.0288%, while the latest actual settlement was about +0.1155%, raising the cost of holding long positions.
KOMA currently lacks cross-confirmation from Binance spot, and quantity OI cannot identify whether new positions are net long or short. The simultaneous expansion of volume, price, and open interest does not prove the rally will necessarily continue, and higher funding rates could amplify a pullback through leverage.
The trend will gain fresh confirmation only if a complete hourly candle breaks above 0.021643 USDT on rising volume while OI growth remains moderate. If it falls below 0.019779 USDT on rising volume accompanied by contracting OI, I would prioritize guarding against high-level deleveraging.
* NFA, DYOR
The latest complete 1-hour period saw a 3.72% gain and a 4.35% increase in OI, while trading volume fell 36.49% from the prior period. Momentum remains, but marginal trading activity has cooled; the indicative funding rate is about +0.0288%, while the latest actual settlement was about +0.1155%, raising the cost of holding long positions.
KOMA currently lacks cross-confirmation from Binance spot, and quantity OI cannot identify whether new positions are net long or short. The simultaneous expansion of volume, price, and open interest does not prove the rally will necessarily continue, and higher funding rates could amplify a pullback through leverage.
The trend will gain fresh confirmation only if a complete hourly candle breaks above 0.021643 USDT on rising volume while OI growth remains moderate. If it falls below 0.019779 USDT on rising volume accompanied by contracting OI, I would prioritize guarding against high-level deleveraging.
* NFA, DYOR
1
758
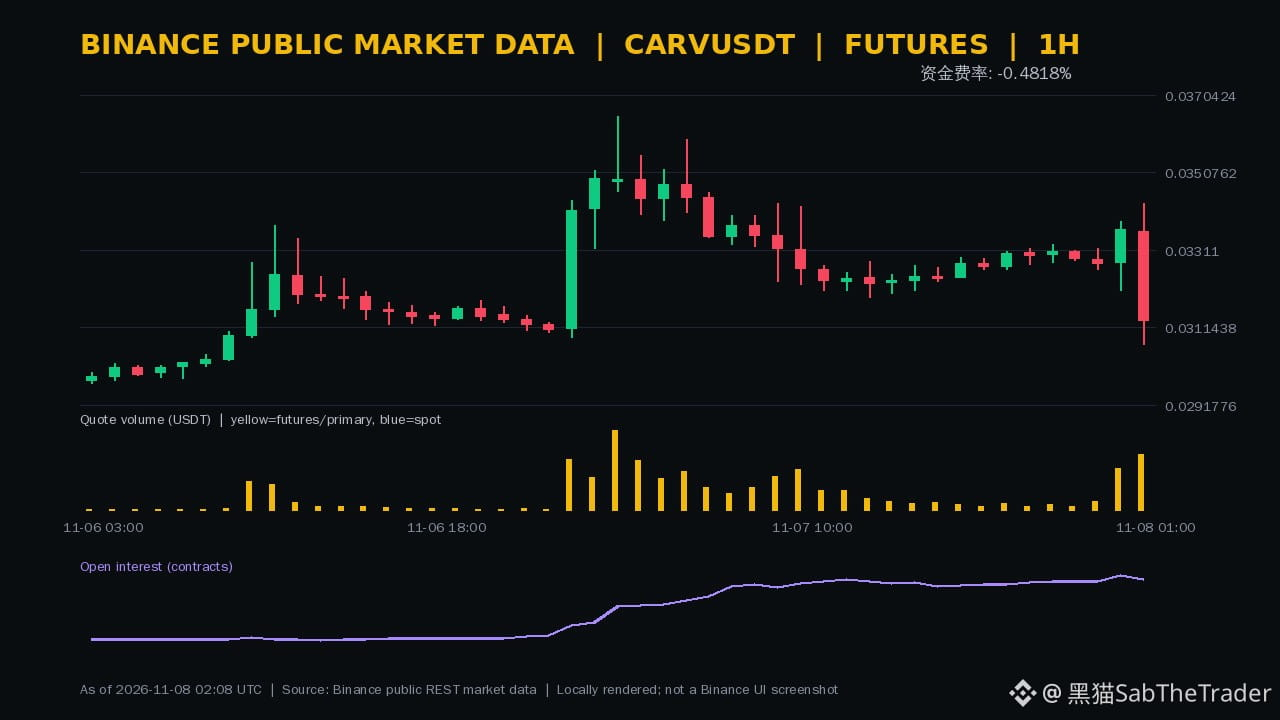
The previous round still had a bullish structure, but the latest complete 1-hour period fell 6.76%, with trading volume up 33.42% from the previous period. The leverage structure of $CARV has shifted to a sharp, high-volume decline.
The last 4 complete hours saw a 5.29% drop, with trading volume 5.77 times that of the previous window; the rolling 24-hour decline widened to 9.79%. Quantity OI fell 3.17% in the latest hour, but the 30-point window is still up 83.33%. Some deleveraging has occurred in the short term, while medium-term positions remain elevated.
The indicative funding rate is around -0.4846%, while the latest actual settlement was around -0.1886%. Deeply negative funding rates may amplify a rebound, but do not prove that a bottom is in; CARV also lacks confirmation from Binance spot trading, and quantity OI cannot identify the net long or short exposure of the remaining positions.
If a complete hourly candle recovers 0.03429 USDT and OI growth stabilizes, the sharp-drop structure would begin to ease. If the price falls below 0.03071 USDT, trading volume continues to increase, and OI remains elevated, I would prioritize guarding against a second squeeze.
* NFA, DYOR
The previous round still had a bullish structure, but the latest complete 1-hour period fell 6.76%, with trading volume up 33.42% from the previous period. The leverage structure of $CARV has shifted to a sharp, high-volume decline.
The last 4 complete hours saw a 5.29% drop, with trading volume 5.77 times that of the previous window; the rolling 24-hour decline widened to 9.79%. Quantity OI fell 3.17% in the latest hour, but the 30-point window is still up 83.33%. Some deleveraging has occurred in the short term, while medium-term positions remain elevated.
The indicative funding rate is around -0.4846%, while the latest actual settlement was around -0.1886%. Deeply negative funding rates may amplify a rebound, but do not prove that a bottom is in; CARV also lacks confirmation from Binance spot trading, and quantity OI cannot identify the net long or short exposure of the remaining positions.
If a complete hourly candle recovers 0.03429 USDT and OI growth stabilizes, the sharp-drop structure would begin to ease. If the price falls below 0.03071 USDT, trading volume continues to increase, and OI remains elevated, I would prioritize guarding against a second squeeze.
* NFA, DYOR
The last 4 complete hours saw a 5.29% drop, with trading volume 5.77 times that of the previous window; the rolling 24-hour decline widened to 9.79%. Quantity OI fell 3.17% in the latest hour, but the 30-point window is still up 83.33%. Some deleveraging has occurred in the short term, while medium-term positions remain elevated.
The indicative funding rate is around -0.4846%, while the latest actual settlement was around -0.1886%. Deeply negative funding rates may amplify a rebound, but do not prove that a bottom is in; CARV also lacks confirmation from Binance spot trading, and quantity OI cannot identify the net long or short exposure of the remaining positions.
If a complete hourly candle recovers 0.03429 USDT and OI growth stabilizes, the sharp-drop structure would begin to ease. If the price falls below 0.03071 USDT, trading volume continues to increase, and OI remains elevated, I would prioritize guarding against a second squeeze.
* NFA, DYOR
243
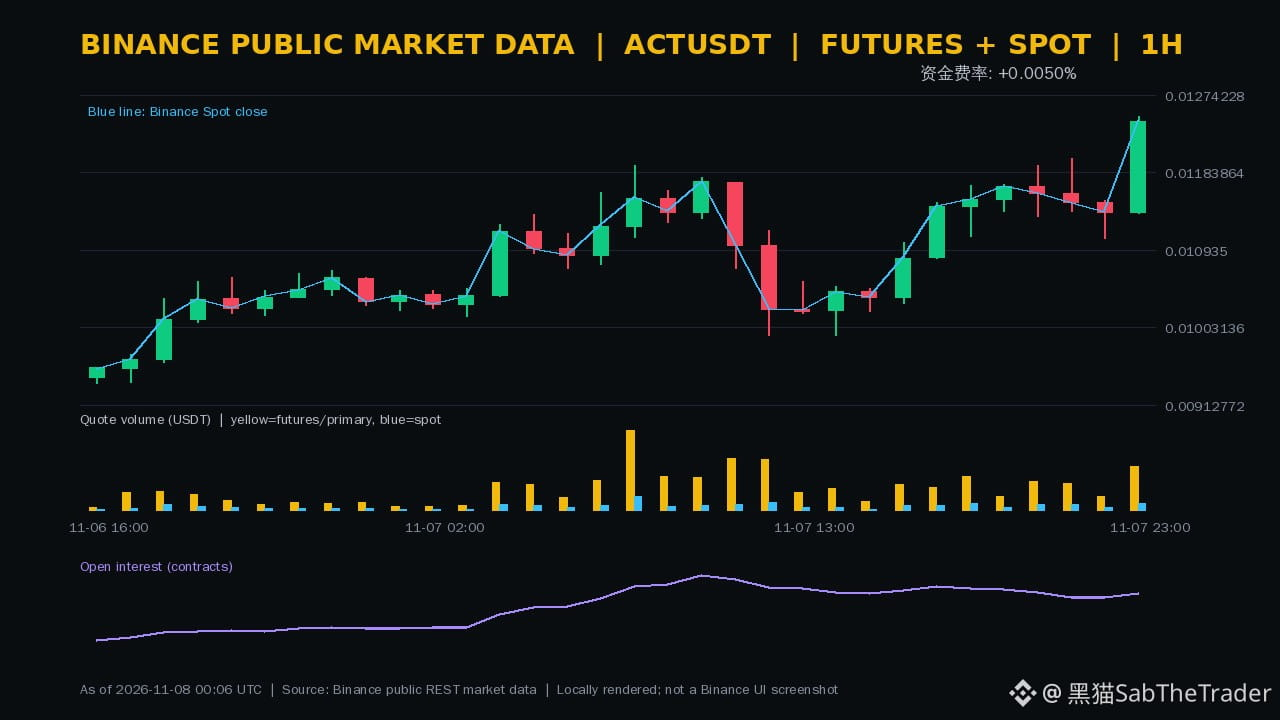
The latest completed 1-hour period rose 9.36%, with trading value up 216.23% from the previous period—$ACT ’s acceleration isn’t coming from price alone. Quantity OI increased 2.70% over the same period, while the 30-point window expanded 32.95%, suggesting this surge was accompanied by new leverage rather than just short covering.
Over the rolling 24 hours, spot and perpetuals rose 21.39% and 20.87%, respectively, moving in the same direction across both markets. But both the indicative and most recent settled funding rates are only +0.0050%, showing no signs yet of longs paying at extreme levels. OI reflects position size only; it can’t prove that new positions are net long, nor confirm that the rally will continue.
A continuation would be better confirmed if a full hourly candle closes above 0.012493 USDT on increased volume, without OI growth accelerating excessively. If price falls back below 0.011365 USDT while OI contracts rapidly, I’d prioritize guarding against deleveraging after the spike.
* NFA, DYOR
The latest completed 1-hour period rose 9.36%, with trading value up 216.23% from the previous period—$ACT ’s acceleration isn’t coming from price alone. Quantity OI increased 2.70% over the same period, while the 30-point window expanded 32.95%, suggesting this surge was accompanied by new leverage rather than just short covering.
Over the rolling 24 hours, spot and perpetuals rose 21.39% and 20.87%, respectively, moving in the same direction across both markets. But both the indicative and most recent settled funding rates are only +0.0050%, showing no signs yet of longs paying at extreme levels. OI reflects position size only; it can’t prove that new positions are net long, nor confirm that the rally will continue.
A continuation would be better confirmed if a full hourly candle closes above 0.012493 USDT on increased volume, without OI growth accelerating excessively. If price falls back below 0.011365 USDT while OI contracts rapidly, I’d prioritize guarding against deleveraging after the spike.
* NFA, DYOR
Over the rolling 24 hours, spot and perpetuals rose 21.39% and 20.87%, respectively, moving in the same direction across both markets. But both the indicative and most recent settled funding rates are only +0.0050%, showing no signs yet of longs paying at extreme levels. OI reflects position size only; it can’t prove that new positions are net long, nor confirm that the rally will continue.
A continuation would be better confirmed if a full hourly candle closes above 0.012493 USDT on increased volume, without OI growth accelerating excessively. If price falls back below 0.011365 USDT while OI contracts rapidly, I’d prioritize guarding against deleveraging after the spike.
* NFA, DYOR
552
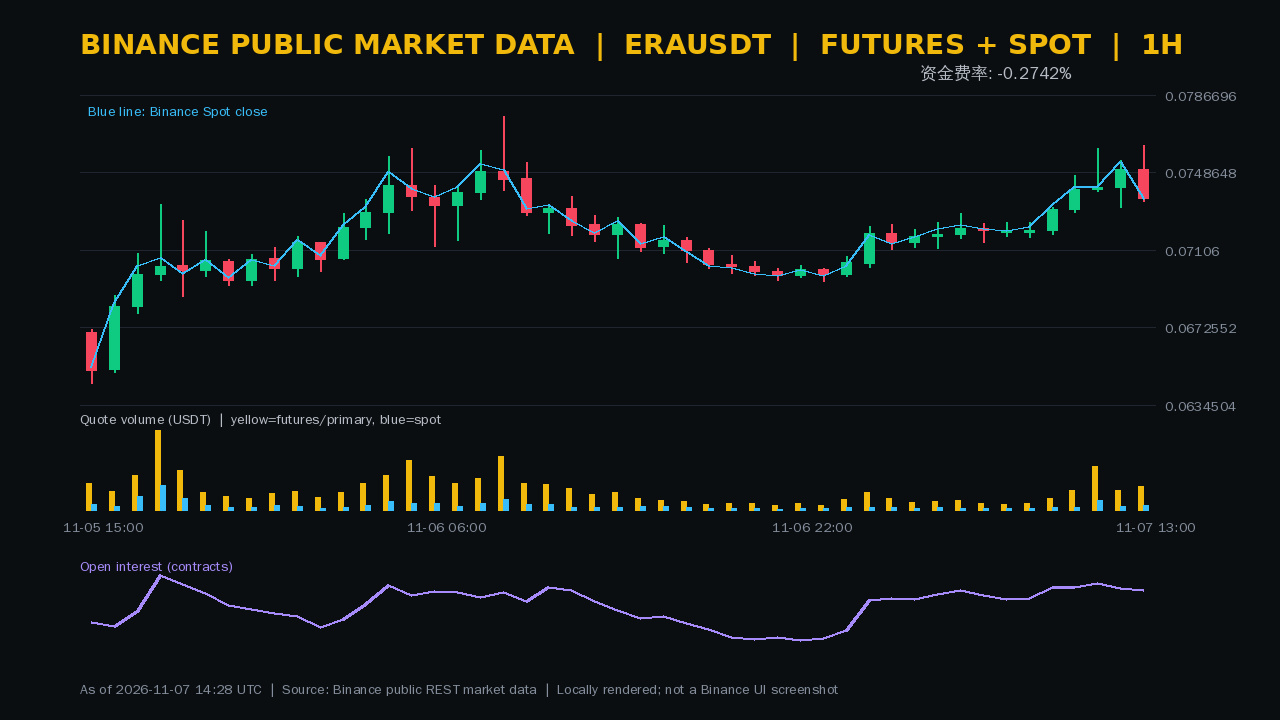
It rose just 2.10% over 24 hours, while the indicative funding rate fell to -0.2742%. Trading volume over the last four completed hours expanded to 3.51 times that of the previous window, and the price of $ERA showed a clear disconnect from the cost of holding short positions.
The price rose 0.75% over those four hours, but fell 1.88% in the latest completed hour, even as trading volume increased 18.06% from the prior hour. Open interest in contracts also declined 0.29% over the same period, rising just 1.02% over the 30-point window. The surge in volume was not accompanied by sustained position building.
The latest realized funding rate was about -0.3236%. Such an extreme negative reading could amplify a rebound, but it does not by itself prove that short positions are crowded, much less confirm that the rally will continue. Spot and perpetual futures posted similar 24-hour gains, with no sign of spot leading the move on its own.
If the price gets back above 0.07621 USDT on a completed hourly candle, with volume holding up and open interest recovering modestly, I would view that as a structural strengthening. If it falls below 0.07292 USDT and volume continues to expand, even an extreme negative funding rate won't prevent further deleveraging.
* NFA, DYOR
It rose just 2.10% over 24 hours, while the indicative funding rate fell to -0.2742%. Trading volume over the last four completed hours expanded to 3.51 times that of the previous window, and the price of $ERA showed a clear disconnect from the cost of holding short positions.
The price rose 0.75% over those four hours, but fell 1.88% in the latest completed hour, even as trading volume increased 18.06% from the prior hour. Open interest in contracts also declined 0.29% over the same period, rising just 1.02% over the 30-point window. The surge in volume was not accompanied by sustained position building.
The latest realized funding rate was about -0.3236%. Such an extreme negative reading could amplify a rebound, but it does not by itself prove that short positions are crowded, much less confirm that the rally will continue. Spot and perpetual futures posted similar 24-hour gains, with no sign of spot leading the move on its own.
If the price gets back above 0.07621 USDT on a completed hourly candle, with volume holding up and open interest recovering modestly, I would view that as a structural strengthening. If it falls below 0.07292 USDT and volume continues to expand, even an extreme negative funding rate won't prevent further deleveraging.
* NFA, DYOR
The price rose 0.75% over those four hours, but fell 1.88% in the latest completed hour, even as trading volume increased 18.06% from the prior hour. Open interest in contracts also declined 0.29% over the same period, rising just 1.02% over the 30-point window. The surge in volume was not accompanied by sustained position building.
The latest realized funding rate was about -0.3236%. Such an extreme negative reading could amplify a rebound, but it does not by itself prove that short positions are crowded, much less confirm that the rally will continue. Spot and perpetual futures posted similar 24-hour gains, with no sign of spot leading the move on its own.
If the price gets back above 0.07621 USDT on a completed hourly candle, with volume holding up and open interest recovering modestly, I would view that as a structural strengthening. If it falls below 0.07292 USDT and volume continues to expand, even an extreme negative funding rate won't prevent further deleveraging.
* NFA, DYOR
825
#BinancePick Check in, check in 🫡 Looks like there's little chance of making the leaderboard this week, so I'll just take it slow.
#BinancePick Check in, check in 🫡 Looks like there's little chance of making the leaderboard this week, so I'll just take it slow.

2
2
554
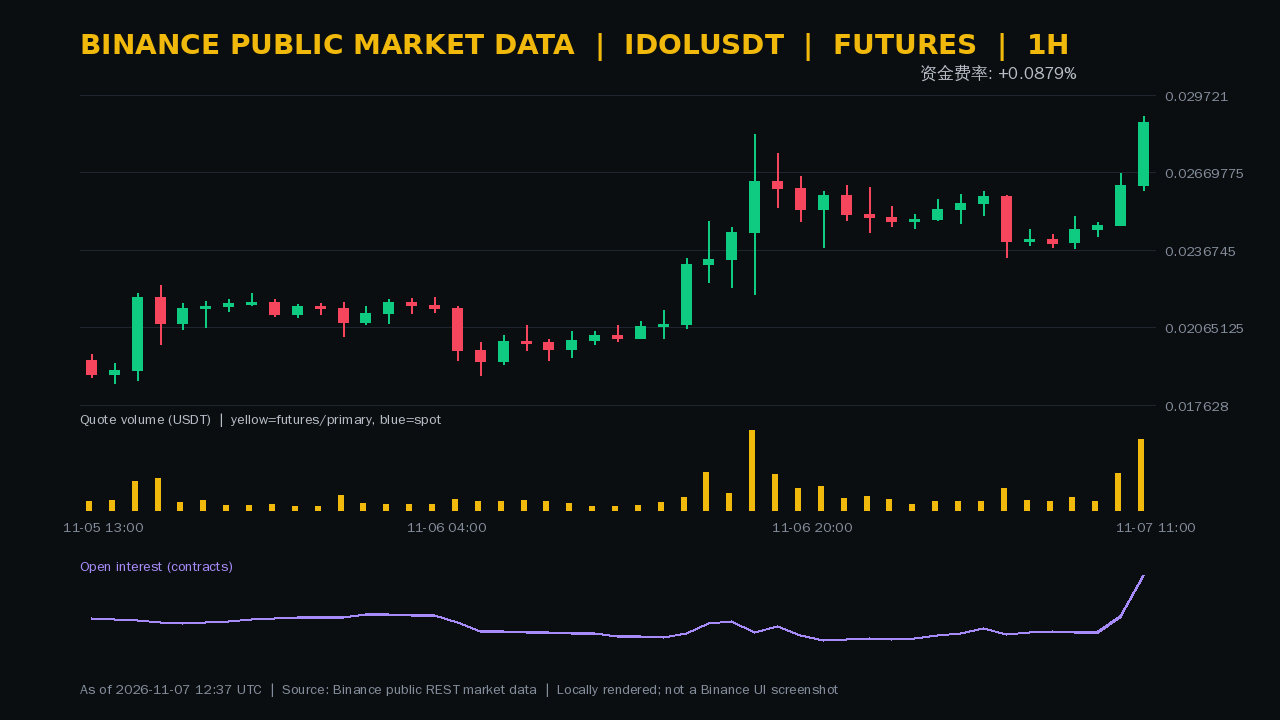
Up 38.62% in 24 hours, with a further 19.56% gain over the last 4 complete hours. Turnover in the latest 1-hour period increased 91.84% compared with the previous hour. The price and volume action of $IDOL is accelerating, and contract-count OI is rising in tandem.
The latest complete 1-hour period saw a 9.27% gain in price and a 5.62% increase in OI; over a 30-point window, OI is up 7.66%. Price, trading volume, and positions are expanding together, suggesting new leverage is coming in—and making the structure more vulnerable to crowded chasing.
The indicative funding rate is around +0.0879%, while the most recent actual settlement was around +0.0820%, meaning the cost of holding long positions has risen significantly. IDOL currently has only a Binance perpetual market, with no spot-market cross-confirmation; contract-count OI also cannot identify net long or short positioning, so the current expansion in tandem does not prove that the rally will necessarily continue.
If price pulls back to 0.026001 USDT and trading activity cools while OI remains stable, the strong structure may still find support. If it breaks below that level and OI contracts rapidly, I would prioritize guarding against a leverage unwind. Whether price can hold above 0.028887 USDT on increased volume will be the next momentum confirmation.
* NFA, DYOR
Up 38.62% in 24 hours, with a further 19.56% gain over the last 4 complete hours. Turnover in the latest 1-hour period increased 91.84% compared with the previous hour. The price and volume action of $IDOL is accelerating, and contract-count OI is rising in tandem.
The latest complete 1-hour period saw a 9.27% gain in price and a 5.62% increase in OI; over a 30-point window, OI is up 7.66%. Price, trading volume, and positions are expanding together, suggesting new leverage is coming in—and making the structure more vulnerable to crowded chasing.
The indicative funding rate is around +0.0879%, while the most recent actual settlement was around +0.0820%, meaning the cost of holding long positions has risen significantly. IDOL currently has only a Binance perpetual market, with no spot-market cross-confirmation; contract-count OI also cannot identify net long or short positioning, so the current expansion in tandem does not prove that the rally will necessarily continue.
If price pulls back to 0.026001 USDT and trading activity cools while OI remains stable, the strong structure may still find support. If it breaks below that level and OI contracts rapidly, I would prioritize guarding against a leverage unwind. Whether price can hold above 0.028887 USDT on increased volume will be the next momentum confirmation.
* NFA, DYOR
The latest complete 1-hour period saw a 9.27% gain in price and a 5.62% increase in OI; over a 30-point window, OI is up 7.66%. Price, trading volume, and positions are expanding together, suggesting new leverage is coming in—and making the structure more vulnerable to crowded chasing.
The indicative funding rate is around +0.0879%, while the most recent actual settlement was around +0.0820%, meaning the cost of holding long positions has risen significantly. IDOL currently has only a Binance perpetual market, with no spot-market cross-confirmation; contract-count OI also cannot identify net long or short positioning, so the current expansion in tandem does not prove that the rally will necessarily continue.
If price pulls back to 0.026001 USDT and trading activity cools while OI remains stable, the strong structure may still find support. If it breaks below that level and OI contracts rapidly, I would prioritize guarding against a leverage unwind. Whether price can hold above 0.028887 USDT on increased volume will be the next momentum confirmation.
* NFA, DYOR
641
Log in to explore more content
Join global crypto users on Binance Square
⚡️ Get latest and useful information about crypto.
💬 Trusted by the world’s largest crypto exchange.
👍 Discover real insights from verified creators.
Email / Phone number
Trending Topics
HotCPIDecemberHikePriced
179,959 views
1,944 Discussing
CPI Market Watch | US CPI Rises 0.4% in October, Hotter Than 0.3% Forecast
Binance News
·30 Likes
·42.4k views
StrategyFaces$2.8BSelloffRiskFromMSCIRemoval
3,038 views
42 Discussing
AnthropicRejectsIPODelayValuationinQuestion
280,720 views
2,380 Discussing