🚨 $BTC $USDT SURGES ABOVE $80,000! IS THE BULLISH MOMENTUM BACK? 🚀📈
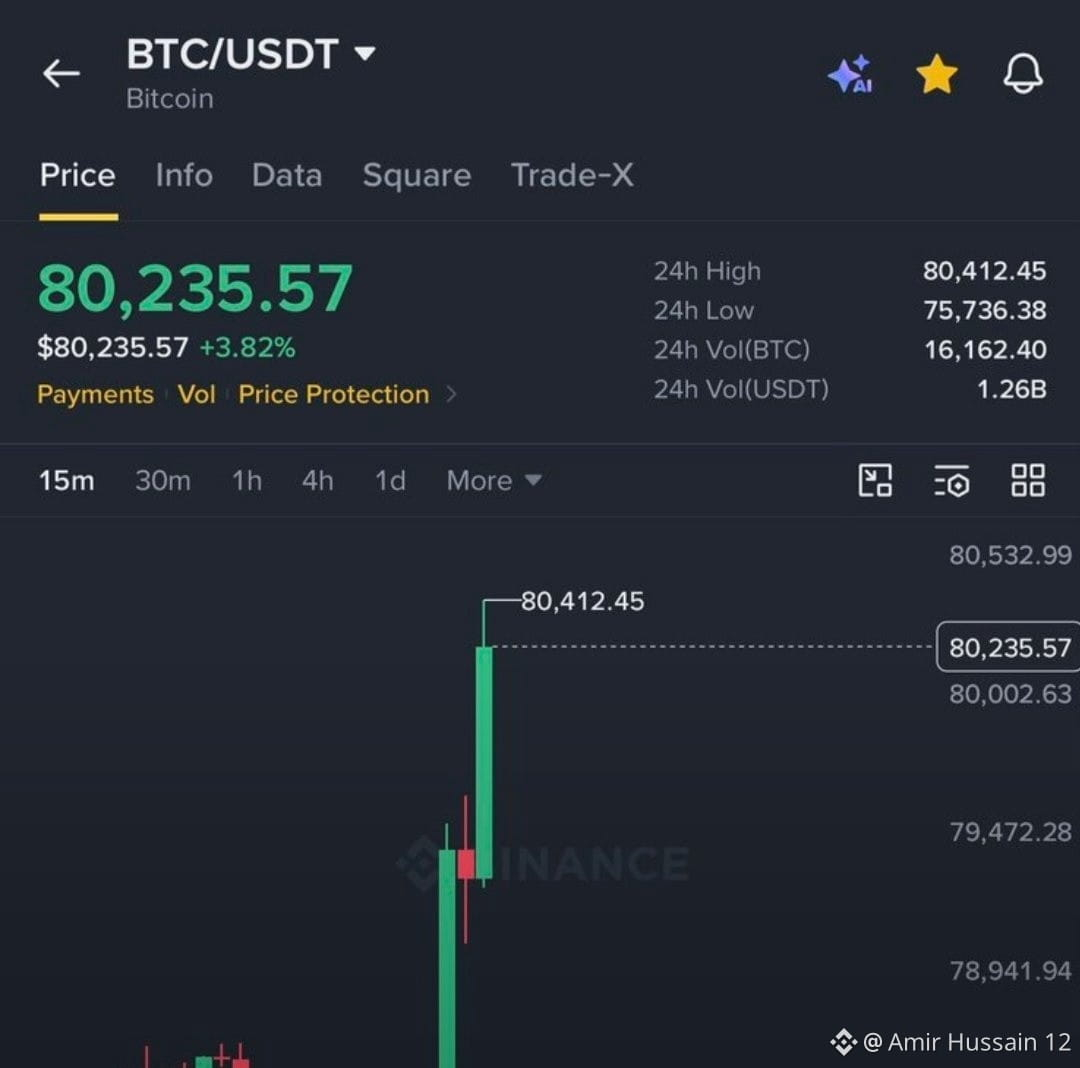
Bitcoin ($BTC ) is showing impressive strength! The latest chart shows BTC trading around $80,235, up approximately 3.82% in the last 24 hours.
After experiencing downside pressure, Bitcoin has made a strong upward move, with buyers stepping in aggressively. The latest 15-minute chart also shows a powerful green candle, suggesting strong short-term buying momentum.
🔥 Key Market Levels:
📈 Resistance: $80,412 – $80,533
💚 Current Price: $80,235
📉 Support: $80,000 – $79,472
🔍 What Happens Next?
Bullish Scenario: If BTC breaks above $80,412 and holds that level, buyers could push the price toward higher resistance zones.
Bearish Scenario: If Bitcoin fails to maintain its momentum and drops below $80,000, we could see a short-term pullback.
💡 My Market View:
Bitcoin is showing positive momentum, but confirmation is important. Watch trading volume, candle closes, and key support levels before making any trading decision.
🚀 BIG QUESTION: Can BTC reach $82,000 next, or will sellers take control again?$BTC
#BinanceReopensWithdrawalsForMoreAssets #BTCRebounds80K #Binance98PercentReplenished
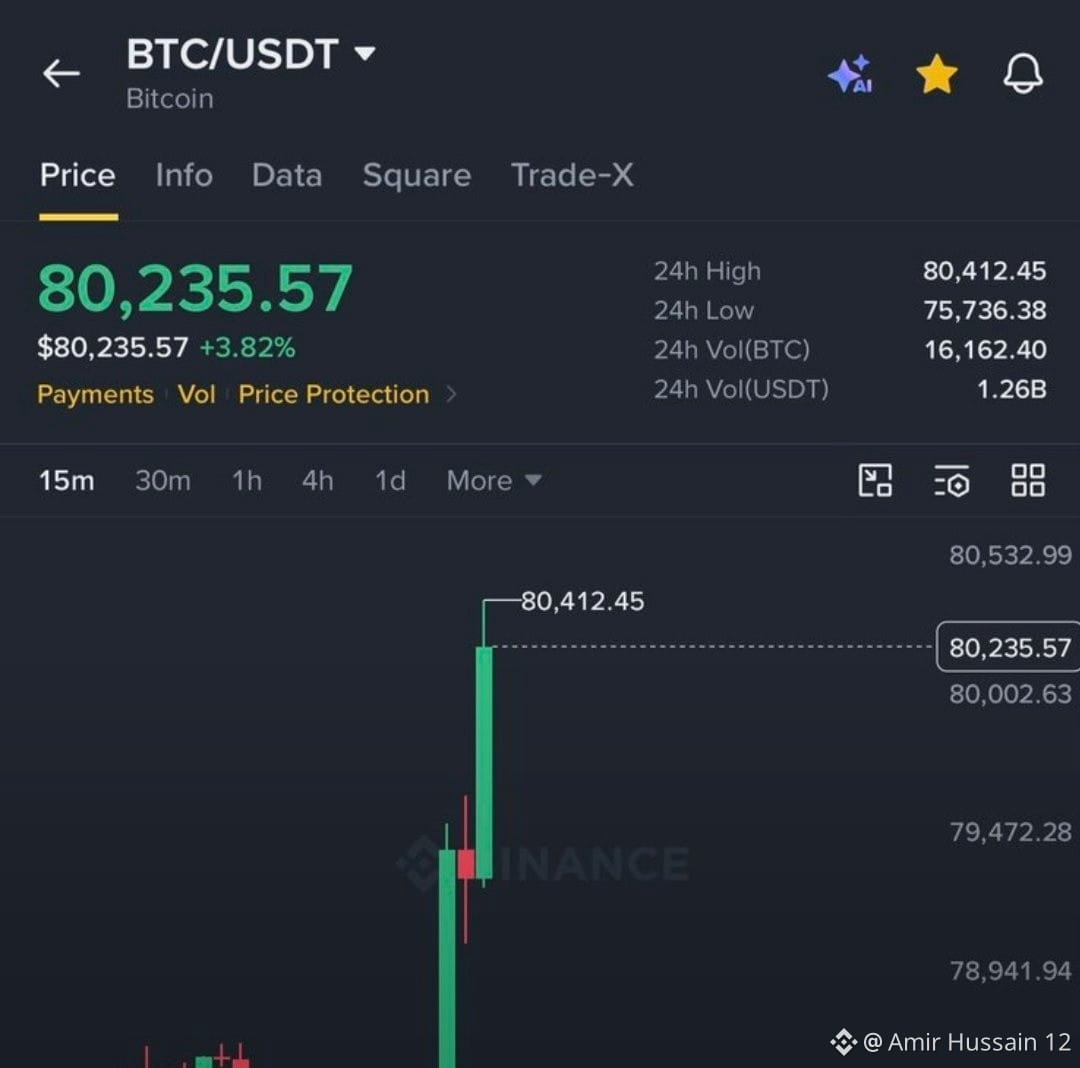
Bitcoin ($BTC ) is showing impressive strength! The latest chart shows BTC trading around $80,235, up approximately 3.82% in the last 24 hours.
After experiencing downside pressure, Bitcoin has made a strong upward move, with buyers stepping in aggressively. The latest 15-minute chart also shows a powerful green candle, suggesting strong short-term buying momentum.
🔥 Key Market Levels:
📈 Resistance: $80,412 – $80,533
💚 Current Price: $80,235
📉 Support: $80,000 – $79,472
🔍 What Happens Next?
Bullish Scenario: If BTC breaks above $80,412 and holds that level, buyers could push the price toward higher resistance zones.
Bearish Scenario: If Bitcoin fails to maintain its momentum and drops below $80,000, we could see a short-term pullback.
💡 My Market View:
Bitcoin is showing positive momentum, but confirmation is important. Watch trading volume, candle closes, and key support levels before making any trading decision.
🚀 BIG QUESTION: Can BTC reach $82,000 next, or will sellers take control again?$BTC
#BinanceReopensWithdrawalsForMoreAssets #BTCRebounds80K #Binance98PercentReplenished