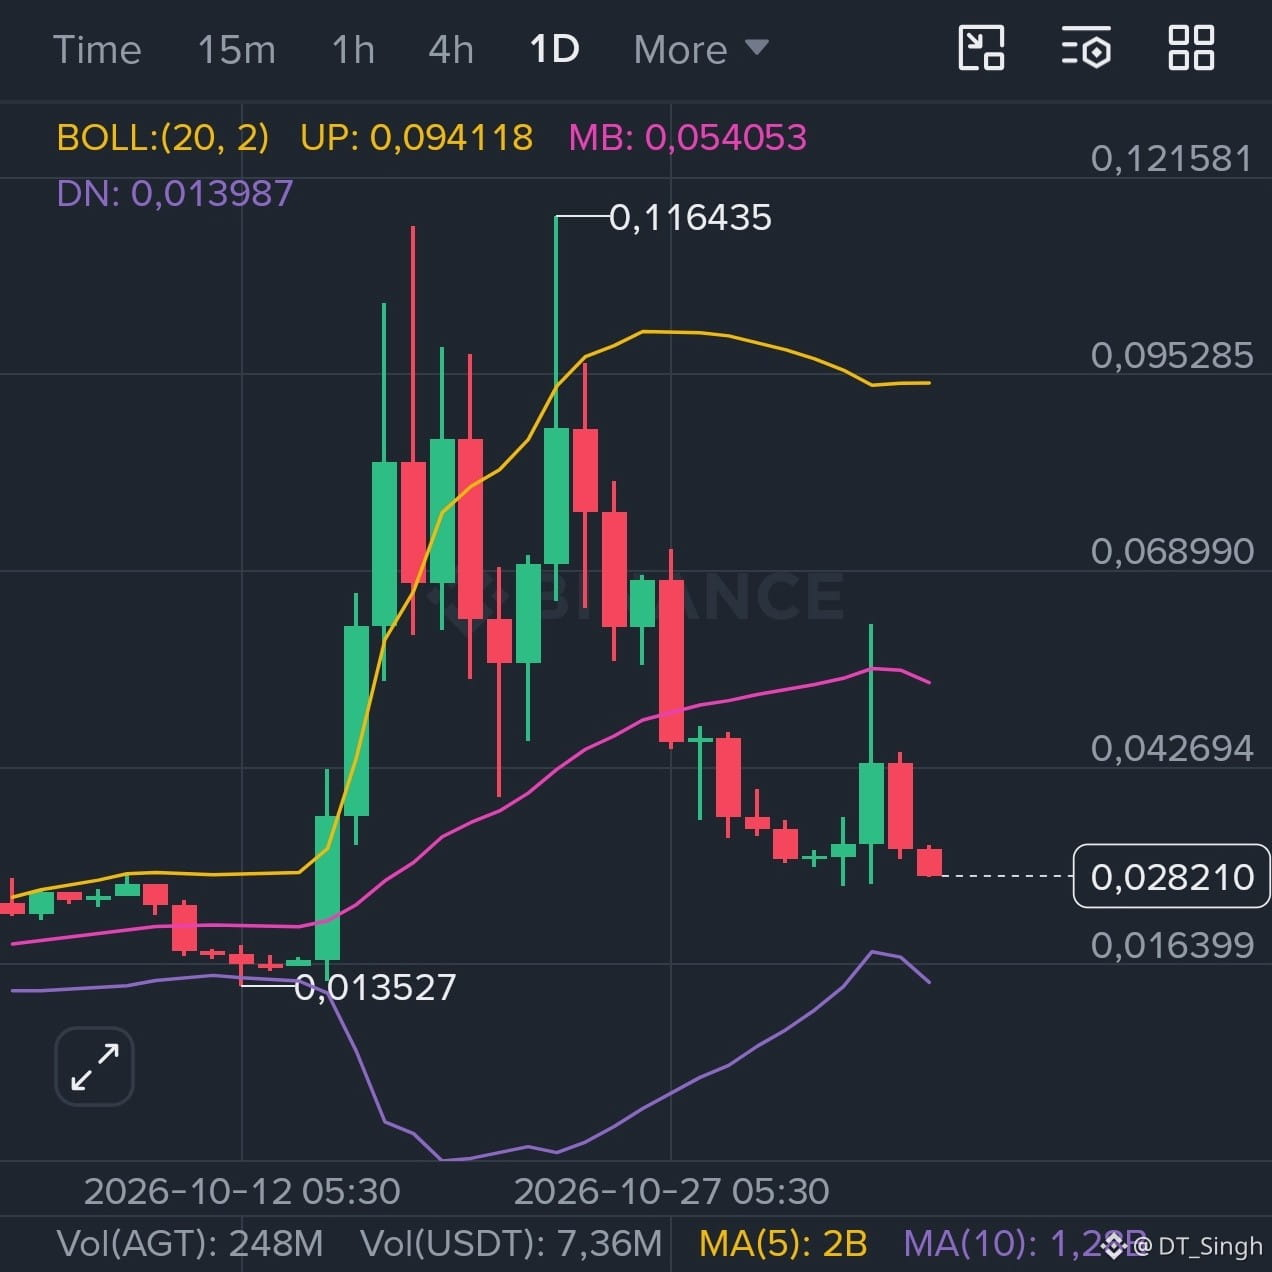

$AGT is down 23.72% in 24h and trading at 0.02821, right on top of its 24h low of 0.02802 📉
Chart levels I'm watching:
🔴 Resistance: 0.0387 (24h high) and 0.0434 (where the last bounce stalled)
🟢 Support: 0.0280 (24h low, being tested now), then 0.0164
🟡 Key level: 0.0135 (the swing low where the run started)
The daily chart shows the earlier bounce printed a long upper wick, and red candles followed. That's a lower high, so buyers couldn't hold the move. Volume spiked on the bounce day and has been lighter since
Context: price is about 76% below the 0.1164 peak, but still about 2x above the 0.0135 low. It's -38.75% over 7 days, but +100.93% over 90 days and +736.60% over 1 year, so the bigger trend is still up
Holding 0.0280 matters here. Losing it could open a move toward 0.0164, while a close back above 0.0434 would show buyers returning
Do you see this as a healthy pullback or a trend change? 👇
#BinanceReopensWithdrawalsForMoreAssets
Chart-based observation only, not financial advice. NFA, manage your own risk
Chart levels I'm watching:
🔴 Resistance: 0.0387 (24h high) and 0.0434 (where the last bounce stalled)
🟢 Support: 0.0280 (24h low, being tested now), then 0.0164
🟡 Key level: 0.0135 (the swing low where the run started)
The daily chart shows the earlier bounce printed a long upper wick, and red candles followed. That's a lower high, so buyers couldn't hold the move. Volume spiked on the bounce day and has been lighter since
Context: price is about 76% below the 0.1164 peak, but still about 2x above the 0.0135 low. It's -38.75% over 7 days, but +100.93% over 90 days and +736.60% over 1 year, so the bigger trend is still up
Holding 0.0280 matters here. Losing it could open a move toward 0.0164, while a close back above 0.0434 would show buyers returning
Do you see this as a healthy pullback or a trend change? 👇
#BinanceReopensWithdrawalsForMoreAssets
Chart-based observation only, not financial advice. NFA, manage your own risk