
📊 $LYN & $JCT — TWO CHARTS, MULTIPLE OPPORTUNITIES! 👀
I'm watching these two closely because both are approaching important decision zones. But I'm not predicting blindly. I have a plan for both bullish and bearish scenarios.
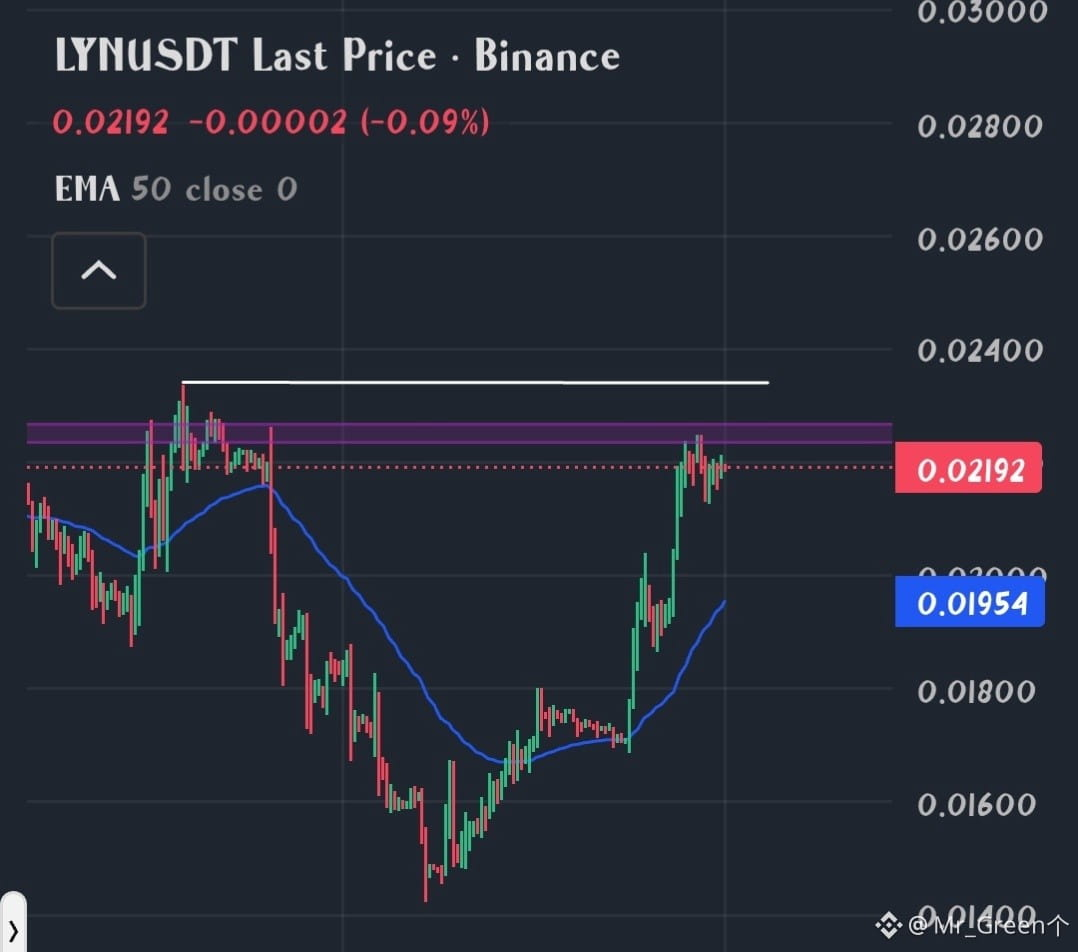
🟢 $LYN — BREAKOUT OR BREAKDOWN?
LYN is approaching the resistance zone around $0.0223–$0.0228. Here's what I'm waiting for:
If price breaks above resistance and sweeps the liquidity resting above the white line (around $0.0233), I'll wait for a pullback. If the previous resistance successfully turns into support, that could provide a good LONG opportunity.
But if price fails to hold the current support around $0.0219 and breaks down with bearish momentum, we can look for a SHORT opportunity instead.
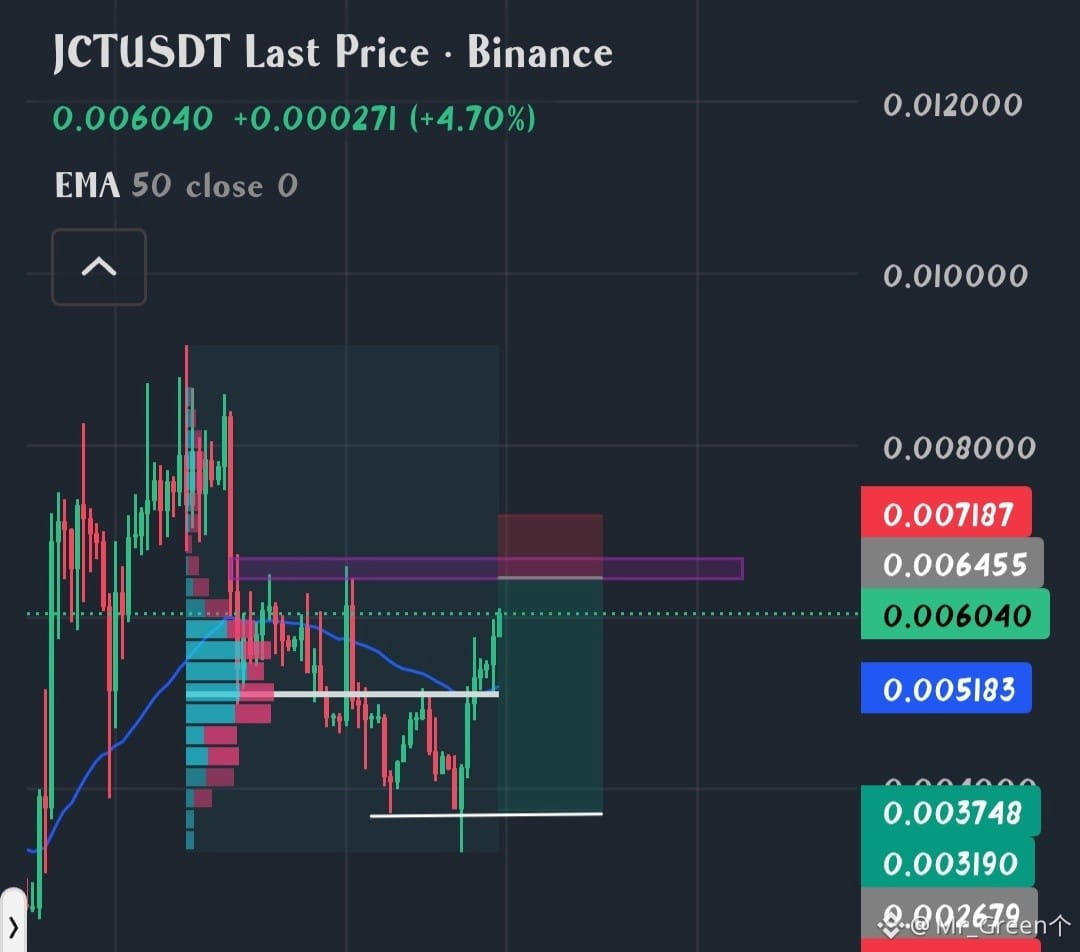
🔴 JCT — WATCHING THE SUPPLY ZONE!
JCT has already made a massive rally, and I'm now watching the supply zone around $0.00645, where significant selling pressure appeared.
My preferred scenario is a SHORT from this zone.
Here's where the Fixed Range Volume Profile becomes important. I'll use the Point of Control (POC), where the highest trading volume occurred, as a potential profit-taking area.
If price reaches the POC and continues facing rejection below it, we can consider holding the remaining SHORT position.
However, if buyers reclaim the POC, hold above it and generate strong bullish momentum, I'll reconsider the SHORT and look for a potential LONG setup.
MY TAKE:
For LYN, I'm waiting for a liquidity sweep and retest. For JCT, I'm watching the supply zone and volume profile reaction.
Two different strategies, but the same principle: let price confirm the direction before entering.
No guessing, no FOMO. Just follow the market structure! 🎯
Which setup are you watching more closely?
Follow for more technical analysis! 👇
I'm watching these two closely because both are approaching important decision zones. But I'm not predicting blindly. I have a plan for both bullish and bearish scenarios.
🟢 $LYN — BREAKOUT OR BREAKDOWN?
LYN is approaching the resistance zone around $0.0223–$0.0228. Here's what I'm waiting for:
If price breaks above resistance and sweeps the liquidity resting above the white line (around $0.0233), I'll wait for a pullback. If the previous resistance successfully turns into support, that could provide a good LONG opportunity.
But if price fails to hold the current support around $0.0219 and breaks down with bearish momentum, we can look for a SHORT opportunity instead.
🔴 JCT — WATCHING THE SUPPLY ZONE!
JCT has already made a massive rally, and I'm now watching the supply zone around $0.00645, where significant selling pressure appeared.
My preferred scenario is a SHORT from this zone.
Here's where the Fixed Range Volume Profile becomes important. I'll use the Point of Control (POC), where the highest trading volume occurred, as a potential profit-taking area.
If price reaches the POC and continues facing rejection below it, we can consider holding the remaining SHORT position.
However, if buyers reclaim the POC, hold above it and generate strong bullish momentum, I'll reconsider the SHORT and look for a potential LONG setup.
MY TAKE:
For LYN, I'm waiting for a liquidity sweep and retest. For JCT, I'm watching the supply zone and volume profile reaction.
Two different strategies, but the same principle: let price confirm the direction before entering.
No guessing, no FOMO. Just follow the market structure! 🎯
Which setup are you watching more closely?
Follow for more technical analysis! 👇