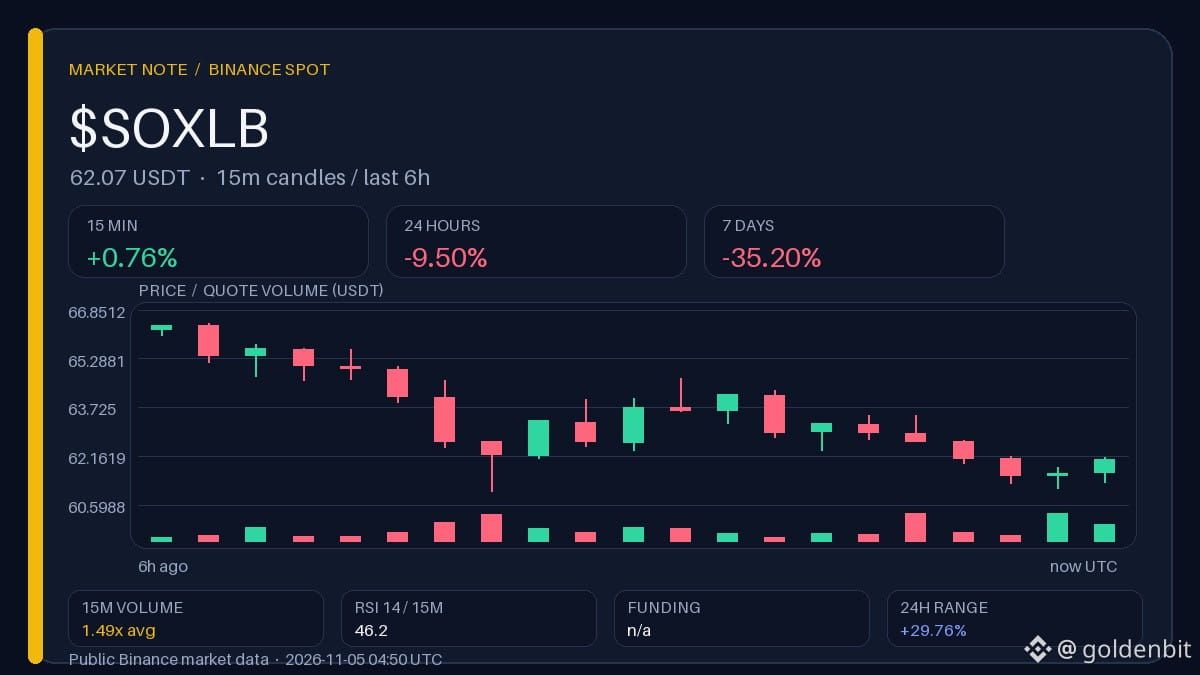
$SOXLB bounces, but the week hasn’t let up yet
A fifteen-minute gain against daily and weekly losses looks more like a pause in the decline than a change in direction. The bounce is taking place on volume 1.49 times higher than usual, but the price remains in the lower part of the range—the reversal is not yet fully confirmed.
Observation range · 5 h
Above 66,4200: A sustained move above the upper boundary of the local range would weaken the interpretation of the current move as a pause in the decline.
Below 61,0300: A return to the lower boundary of the range would confirm that the brief gain has not changed the longer-term trend.
Historical levels; a single wick does not confirm a scenario.
↩️ Recap of the previous “Contrast Radar” edition (04.11 00:48 UTC): SOXLB 72,0900 → 70,8300 USDT (−1.75% in 12 h).
How would volume need to change for the bounce to stop looking like a technical pause?
Binance data, snapshot at 04:50 UTC. The author may receive rewards through Binance Square Write to Earn.
A fifteen-minute gain against daily and weekly losses looks more like a pause in the decline than a change in direction. The bounce is taking place on volume 1.49 times higher than usual, but the price remains in the lower part of the range—the reversal is not yet fully confirmed.
Observation range · 5 h
Above 66,4200: A sustained move above the upper boundary of the local range would weaken the interpretation of the current move as a pause in the decline.
Below 61,0300: A return to the lower boundary of the range would confirm that the brief gain has not changed the longer-term trend.
Historical levels; a single wick does not confirm a scenario.
↩️ Recap of the previous “Contrast Radar” edition (04.11 00:48 UTC): SOXLB 72,0900 → 70,8300 USDT (−1.75% in 12 h).
How would volume need to change for the bounce to stop looking like a technical pause?
Binance data, snapshot at 04:50 UTC. The author may receive rewards through Binance Square Write to Earn.