Top gainer, but volume has yet to confirm $INJ ’s breakout
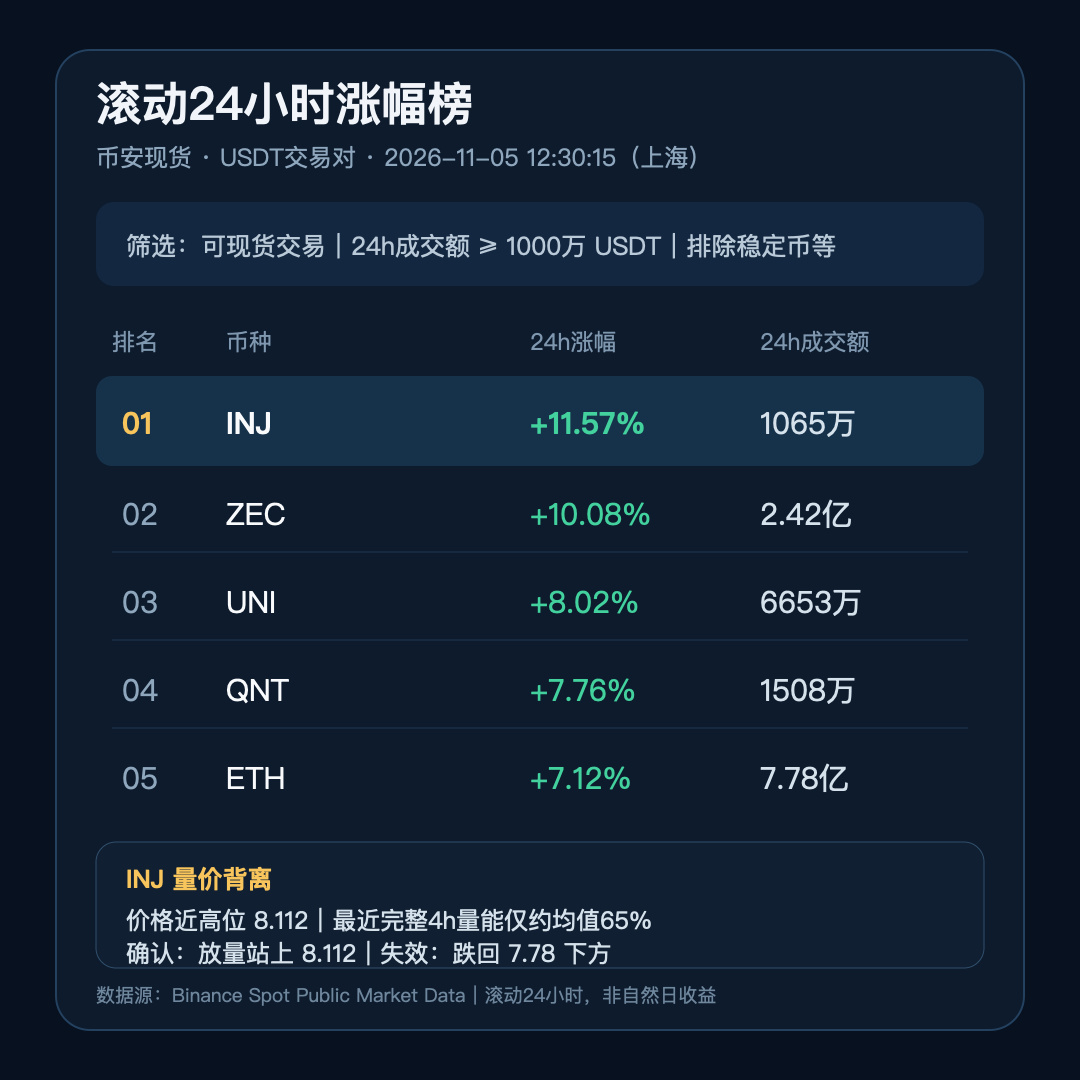
$INJ ranked first on Binance’s rolling 24-hour spot gainers list at 12:30, up 11.57%. But this is not a “see the top spot and chase it” signal: its 24-hour trading volume was only about 10.65 million USDT, just above this screen’s 10 million threshold. The price also failed to move further away from the high after touching 8.112. The gap between leading the rankings and confirming a breakout is volume confirmation.
First, let’s separate facts from interpretation. Public Binance spot data (12:30:15 Shanghai time) showed that the top five assets above the liquidity threshold were INJ +11.57%, ZEC +10.08%, UNI +8.02%, QNT +7.76%, and ETH +7.12%. On November 2, Injective announced Institutional Rail, describing it as a dedicated access layer connecting validators with institutions, professional trading firms, and enterprise applications, and said it was already in production with some institutions. This is verifiable project progress, but the team did not say it directly caused today’s rise. So the claim that “positive news drove this rally” remains market speculation.
More importantly, there is counterevidence. INJ’s most recent completed 4-hour candle closed at 8.048, with about 1.23 million USDT in trading volume—only around 65% of the average for the previous five completed 4-hour candles. The most recent completed 1-hour candle had about 450,000 USDT in volume, or roughly 98% of the average for the previous 20 completed 1-hour candles. The price is near its 24-hour high of 8.112, but volume has not expanded alongside it. This is a classic case of price leading while volume confirmation lags.
For what comes next, watch only two paths:
First, if an hourly close decisively clears 8.112 while that hour’s trading volume significantly exceeds the recent average of about 460,000 USDT, and the price then retests the 8.00–8.11 zone without breaking below it, the move would look more like a valid breakout. The Institutional Rail narrative would also need further validation through real adoption or on-chain activity data.
Second, if repeated attempts to break 8.112 fail and the price falls back below 7.78, this rally is more likely to be a high-beta move within a broader market rebound than an independent trend. A break below 7.78 invalidates this breakout-monitoring framework; a further decline toward 7.47 would mean the earlier breakout zone had largely been erased.
The main risk is that INJ’s market depth is clearly weaker than ZEC’s, UNI’s, and ETH’s, so even small amounts of capital could amplify price moves in either direction. There is no guaranteed causal link between a project announcement and its token price, and relative strength could quickly disappear if the broader market weakens. Tap $INJ first to check real-time 1-hour volume, whether 8.112 can hold, and where a retest lands—then judge whether this top-ranked move is a valid breakout or a spike that volume has yet to catch up with.
$INJ ranked first on Binance’s rolling 24-hour spot gainers list at 12:30, up 11.57%. But this is not a “see the top spot and chase it” signal: its 24-hour trading volume was only about 10.65 million USDT, just above this screen’s 10 million threshold. The price also failed to move further away from the high after touching 8.112. The gap between leading the rankings and confirming a breakout is volume confirmation.
First, let’s separate facts from interpretation. Public Binance spot data (12:30:15 Shanghai time) showed that the top five assets above the liquidity threshold were INJ +11.57%, ZEC +10.08%, UNI +8.02%, QNT +7.76%, and ETH +7.12%. On November 2, Injective announced Institutional Rail, describing it as a dedicated access layer connecting validators with institutions, professional trading firms, and enterprise applications, and said it was already in production with some institutions. This is verifiable project progress, but the team did not say it directly caused today’s rise. So the claim that “positive news drove this rally” remains market speculation.
More importantly, there is counterevidence. INJ’s most recent completed 4-hour candle closed at 8.048, with about 1.23 million USDT in trading volume—only around 65% of the average for the previous five completed 4-hour candles. The most recent completed 1-hour candle had about 450,000 USDT in volume, or roughly 98% of the average for the previous 20 completed 1-hour candles. The price is near its 24-hour high of 8.112, but volume has not expanded alongside it. This is a classic case of price leading while volume confirmation lags.
For what comes next, watch only two paths:
First, if an hourly close decisively clears 8.112 while that hour’s trading volume significantly exceeds the recent average of about 460,000 USDT, and the price then retests the 8.00–8.11 zone without breaking below it, the move would look more like a valid breakout. The Institutional Rail narrative would also need further validation through real adoption or on-chain activity data.
Second, if repeated attempts to break 8.112 fail and the price falls back below 7.78, this rally is more likely to be a high-beta move within a broader market rebound than an independent trend. A break below 7.78 invalidates this breakout-monitoring framework; a further decline toward 7.47 would mean the earlier breakout zone had largely been erased.
The main risk is that INJ’s market depth is clearly weaker than ZEC’s, UNI’s, and ETH’s, so even small amounts of capital could amplify price moves in either direction. There is no guaranteed causal link between a project announcement and its token price, and relative strength could quickly disappear if the broader market weakens. Tap $INJ first to check real-time 1-hour volume, whether 8.112 can hold, and where a retest lands—then judge whether this top-ranked move is a valid breakout or a spike that volume has yet to catch up with.