🩺📉 Is the financial market collapsing or just catching its breath?
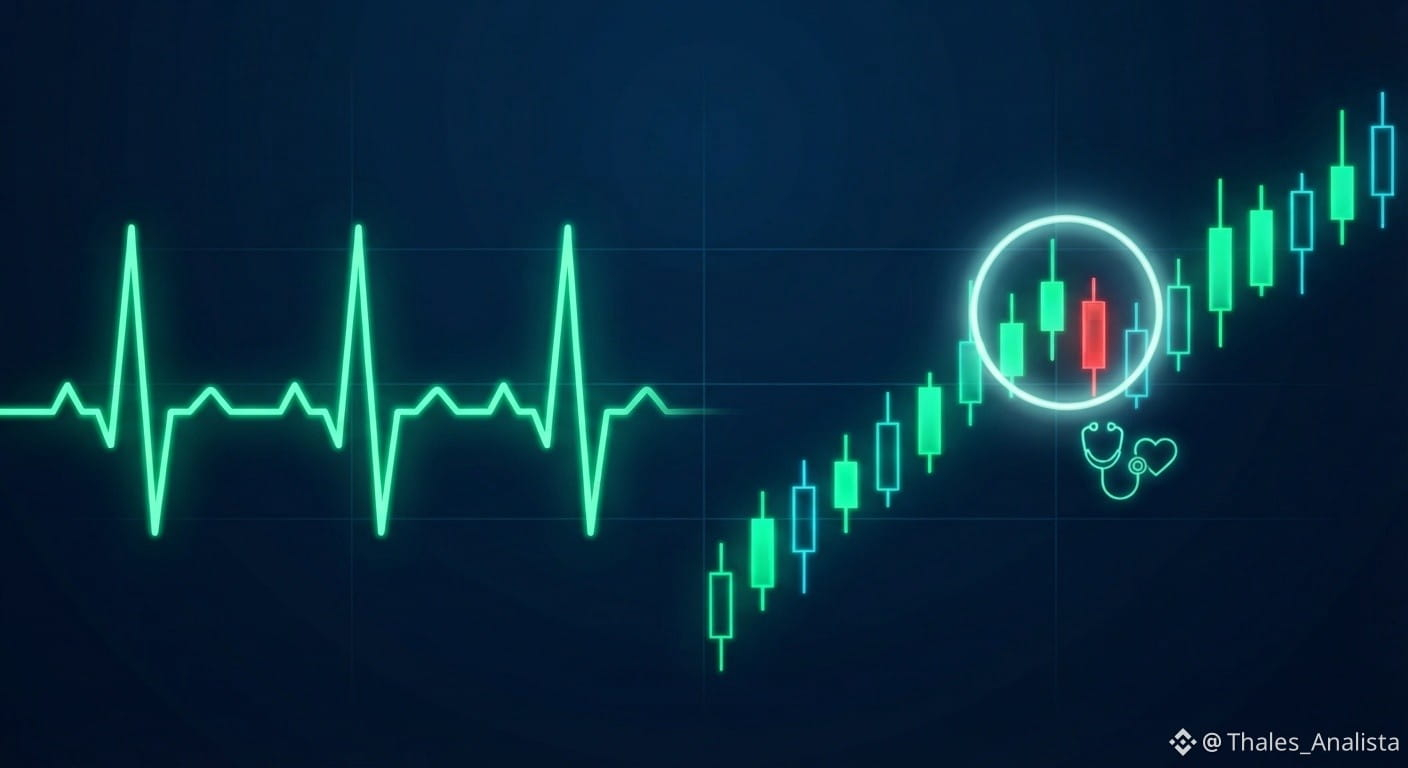
Many beginners panic when they see the first red candles, but corrections are actually vital signs of a healthy market. To understand this without stress, think of a price chart as an electrocardiogram (ECG) of a human heart:
1️⃣ A straight line means death: In both a hospital and on a chart, a lack of fluctuation indicates a lack of liquidity and volume. Price movement proves that an asset is “pulsing” with life.
2️⃣ Systole and diastole: Rises represent contraction (appreciation), while drops represent relaxation (corrections and profit-taking)—a necessary phase to catch your breath.
3️⃣ Rhythm vs. arrhythmia: The real danger isn’t a healthy pullback; it’s parabolic rises driven by FOMO (“fear of missing out”) or vertical drops fueled by FUD (“fear, uncertainty, and doubt”).
📊 The RSI (Relative Strength Index) as a pulse oximeter: This indicator measures the intensity of the “heartbeats,” signaling when the market needs a pause to regain its strength. Conclusion: A controlled pullback is simply the market catching its breath before its next move.
Note: This is educational content. Follow my profile for more analysis: binance.com
▪︎ DYOR (Do Your Own Research): Always conduct your own research before making any decisions in the global digital financial market.
$BTC is mentioned here only as an example; this concept applies to any digital asset.
#Binance #TechnicalAnalysis #Crypto #TokenizedAssets
Many beginners panic when they see the first red candles, but corrections are actually vital signs of a healthy market. To understand this without stress, think of a price chart as an electrocardiogram (ECG) of a human heart:
1️⃣ A straight line means death: In both a hospital and on a chart, a lack of fluctuation indicates a lack of liquidity and volume. Price movement proves that an asset is “pulsing” with life.
2️⃣ Systole and diastole: Rises represent contraction (appreciation), while drops represent relaxation (corrections and profit-taking)—a necessary phase to catch your breath.
3️⃣ Rhythm vs. arrhythmia: The real danger isn’t a healthy pullback; it’s parabolic rises driven by FOMO (“fear of missing out”) or vertical drops fueled by FUD (“fear, uncertainty, and doubt”).
📊 The RSI (Relative Strength Index) as a pulse oximeter: This indicator measures the intensity of the “heartbeats,” signaling when the market needs a pause to regain its strength. Conclusion: A controlled pullback is simply the market catching its breath before its next move.
Note: This is educational content. Follow my profile for more analysis: binance.com
▪︎ DYOR (Do Your Own Research): Always conduct your own research before making any decisions in the global digital financial market.
$BTC is mentioned here only as an example; this concept applies to any digital asset.
#Binance #TechnicalAnalysis #Crypto #TokenizedAssets