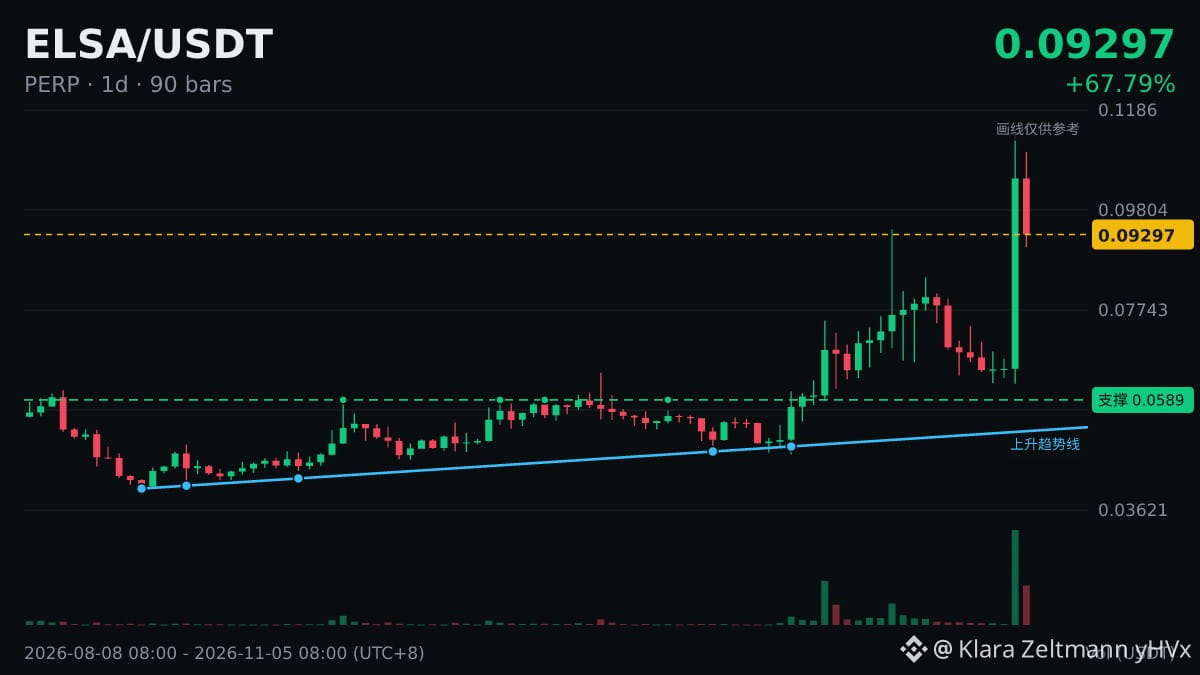
🐋 $ELSA daily RSI is 78.3, in overbought territory.
RSI itself doesn't drive prices, but plenty of people watch it, and the reading influences some people's decisions.
The 14 in RSI means 14 candles: on a 4-hour chart, that covers just over two days (56 hours); on a daily chart, it covers exactly two weeks.
All data describes past market action, and prices can certainly move in the opposite direction.
This is not a recommendation to buy or sell in any form. Trade at your own risk.
RSI itself doesn't drive prices, but plenty of people watch it, and the reading influences some people's decisions.
The 14 in RSI means 14 candles: on a 4-hour chart, that covers just over two days (56 hours); on a daily chart, it covers exactly two weeks.
All data describes past market action, and prices can certainly move in the opposite direction.
This is not a recommendation to buy or sell in any form. Trade at your own risk.