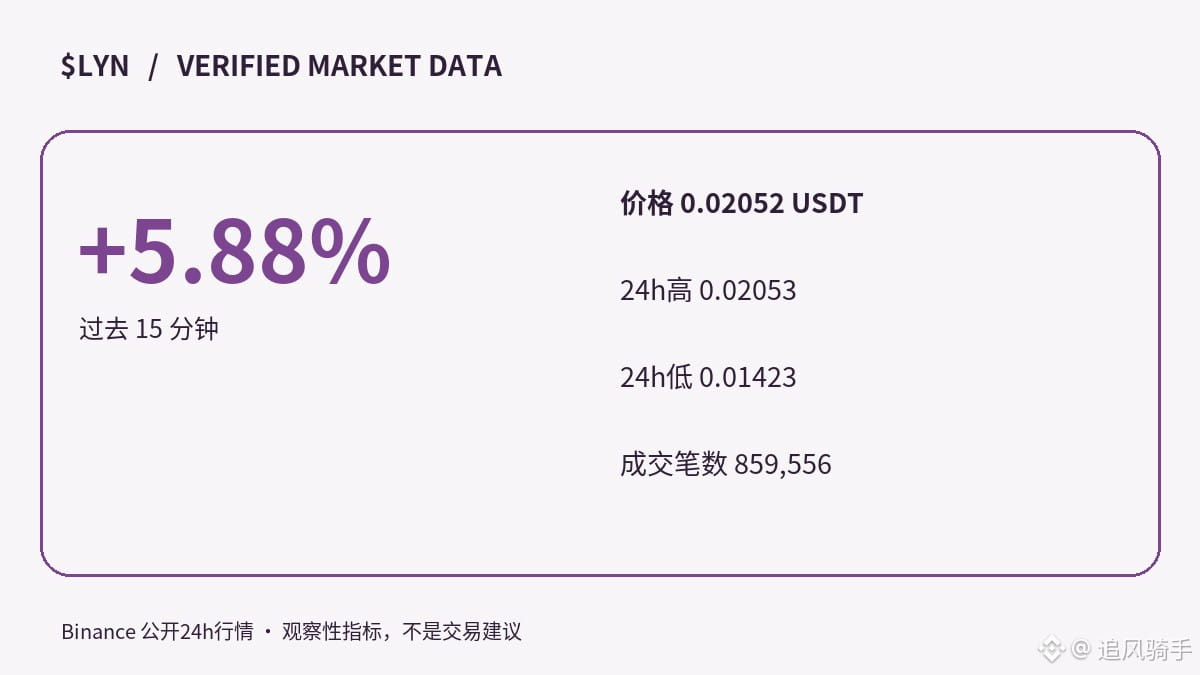
📈【Next Candle】$LYN |15-minute rise of 5.88%
【Unusual Activity Data】Recorded price: 0.02052 USDT; 24-hour trading volume: 42.04 million USDT. Binance USDT-margined futures signal, recorded at 2026-11-05 10:00:59.
【Futures Review】
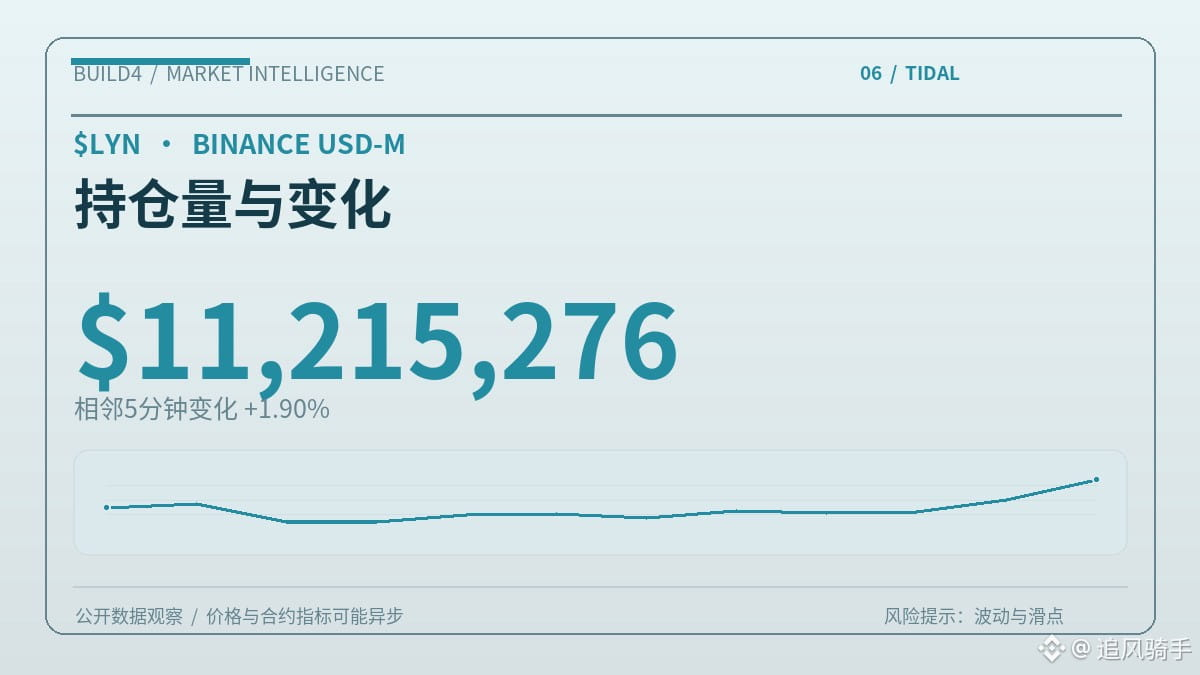
• 5-minute open interest notional value: 12.441 million USDT, down 0.27% from the adjacent 5-minute sample (notional value changes include price effects)
• Latest estimated funding rate: +0.0063% (not yet settled); last two settled rates: +0.0050% / +0.0245%
• Market-wide long/short account ratio: 3.880 (ratio by number of accounts, not net buying volume)
• Large-trader long/short account ratio: 4.311; large-trader position ratio: 1.264 (different metrics)
【My Observations】The price has moved noticeably over a short period, but the change in notional open interest is limited; there is not yet enough evidence to show that leveraged positions have expanded in tandem.
【Divergences and Risk Factors】The current estimated funding rate alone is not enough to show which side is more crowded; the account long/short ratio is noticeably skewed, but the ratio by number of accounts is not the same as the amount of aggressive buying or selling.
【Cross-Check】The latest open interest and funding rate readings may come from different points in time, so they should not be directly combined into a single causal explanation. The position ratios for regular accounts and large traders are based on different metrics; track them separately for subsequent changes rather than treating them as indicators of net inflows.
【What to Check Next】See whether the next 15-minute candle can hold around or above 0.02052 USDT, and compare trading activity over the same interval. If the price quickly falls back below the recorded price, be alert to a short-term spike followed by a pullback. If open interest in the next interval diverges from the price, reassess the current interpretation. Watch for changes in the funding rate at the next snapshot or settlement; do not treat the estimated rate as realized returns.
【Two Possible Scenarios】Continuation scenario: The price remains above the recorded price in the next interval, and trading activity and open interest over the same interval do not noticeably diverge from the price; this would increase confidence in the continuation outlook. Invalidation scenario: The price quickly falls back below the recorded price or open interest drops significantly; give priority to the possibility of a short-term spike giving way to a pullback.
Risk: Short-term volatility, changes in market depth, and slippage may amplify losses. The above is an analysis of public data, not a trading instruction.
【Unusual Activity Data】Recorded price: 0.02052 USDT; 24-hour trading volume: 42.04 million USDT. Binance USDT-margined futures signal, recorded at 2026-11-05 10:00:59.
【Futures Review】
• 5-minute open interest notional value: 12.441 million USDT, down 0.27% from the adjacent 5-minute sample (notional value changes include price effects)
• Latest estimated funding rate: +0.0063% (not yet settled); last two settled rates: +0.0050% / +0.0245%
• Market-wide long/short account ratio: 3.880 (ratio by number of accounts, not net buying volume)
• Large-trader long/short account ratio: 4.311; large-trader position ratio: 1.264 (different metrics)
【My Observations】The price has moved noticeably over a short period, but the change in notional open interest is limited; there is not yet enough evidence to show that leveraged positions have expanded in tandem.
【Divergences and Risk Factors】The current estimated funding rate alone is not enough to show which side is more crowded; the account long/short ratio is noticeably skewed, but the ratio by number of accounts is not the same as the amount of aggressive buying or selling.
【Cross-Check】The latest open interest and funding rate readings may come from different points in time, so they should not be directly combined into a single causal explanation. The position ratios for regular accounts and large traders are based on different metrics; track them separately for subsequent changes rather than treating them as indicators of net inflows.
【What to Check Next】See whether the next 15-minute candle can hold around or above 0.02052 USDT, and compare trading activity over the same interval. If the price quickly falls back below the recorded price, be alert to a short-term spike followed by a pullback. If open interest in the next interval diverges from the price, reassess the current interpretation. Watch for changes in the funding rate at the next snapshot or settlement; do not treat the estimated rate as realized returns.
【Two Possible Scenarios】Continuation scenario: The price remains above the recorded price in the next interval, and trading activity and open interest over the same interval do not noticeably diverge from the price; this would increase confidence in the continuation outlook. Invalidation scenario: The price quickly falls back below the recorded price or open interest drops significantly; give priority to the possibility of a short-term spike giving way to a pullback.
Risk: Short-term volatility, changes in market depth, and slippage may amplify losses. The above is an analysis of public data, not a trading instruction.