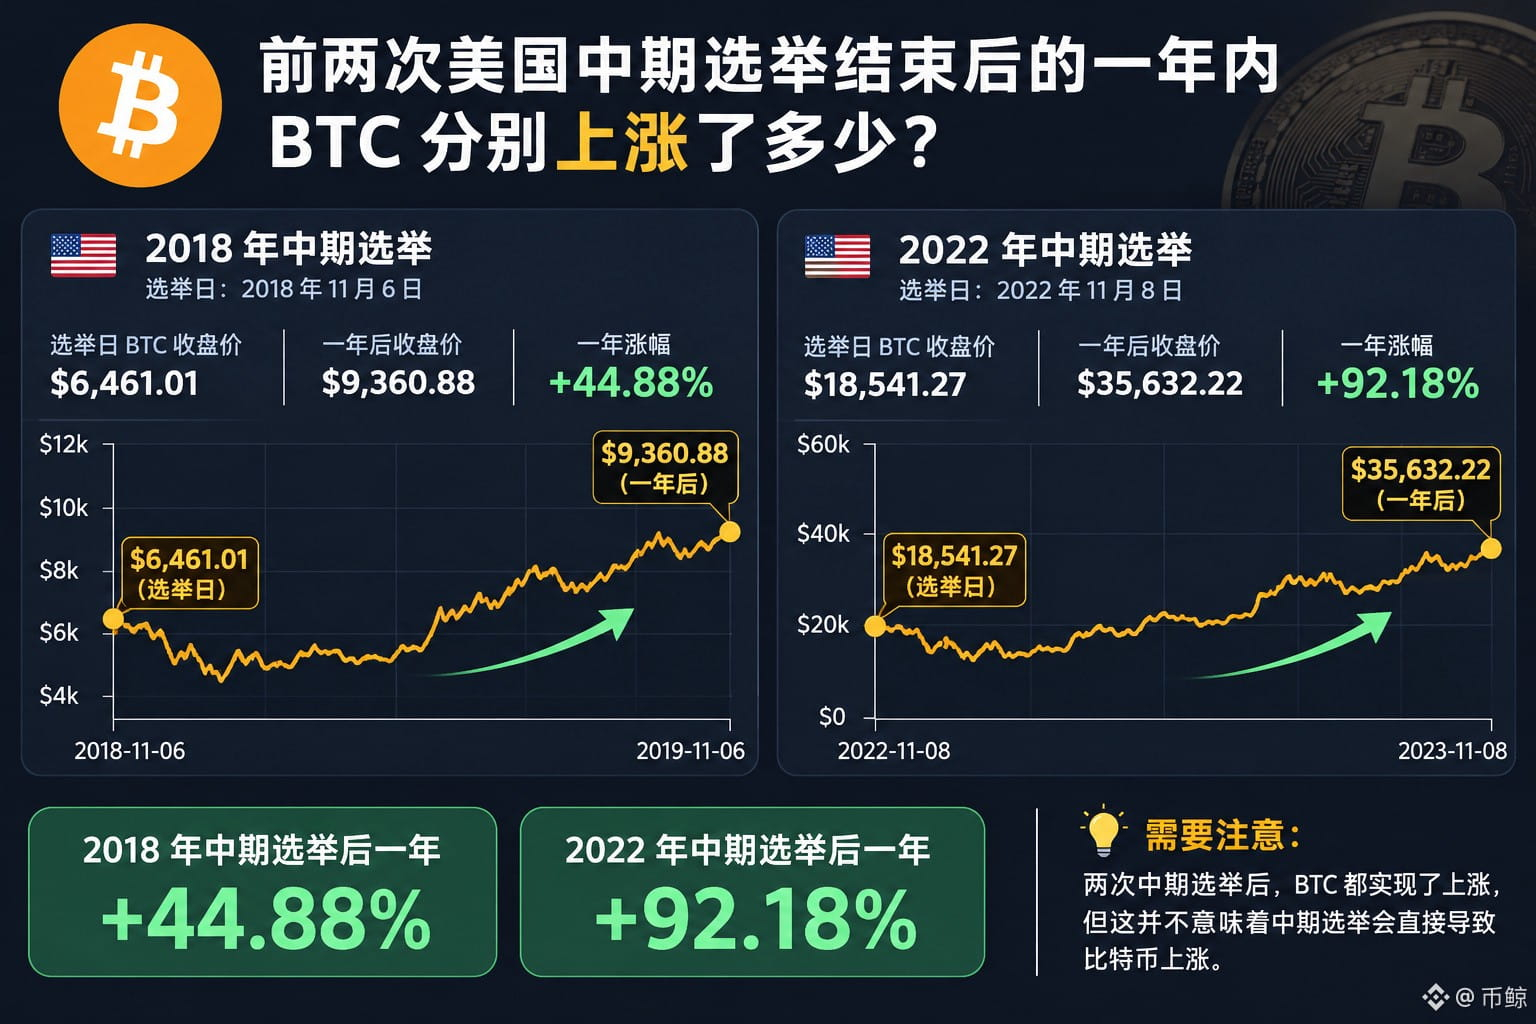
📊 Historical data shows that $BTC rose in the year following each of the last two U.S. midterm elections.
2018 midterm election:
Price on Election Day: $6,461
One year later: $9,360
Gain: +44.88%
2022 midterm election:
Price on Election Day: $18,541
One year later: $35,632
Gain: +92.18%
This time, during the 2026 midterm election period, $BTC also rebounded from around $76,000 to a high of about $81,000, a gain of roughly 7%.
Of course, past performance doesn’t mean history will necessarily repeat itself. The rallies in 2019 and 2023 also took place against their own macroeconomic backdrops and market cycles.
Still, it’s interesting that $BTC posted solid gains after each of the last two midterm elections.
Will this time follow the historical pattern? I’m more focused on post-election fund flows and whether BTC can hold above $80,000.
History can offer a point of reference, but it shouldn’t be treated as a trading signal. Do you think this will spark a new bull market?
Data source: Yahoo Finance, historical daily data
#美国中期选举:市场有哪些期待? #美国10月非农出炉:降息还有戏吗? #美国正式放行个股永续合约 #特朗普家族支持矿企三季度盈利 #韩国拟设加密安全事件即报规则
2018 midterm election:
Price on Election Day: $6,461
One year later: $9,360
Gain: +44.88%
2022 midterm election:
Price on Election Day: $18,541
One year later: $35,632
Gain: +92.18%
This time, during the 2026 midterm election period, $BTC also rebounded from around $76,000 to a high of about $81,000, a gain of roughly 7%.
Of course, past performance doesn’t mean history will necessarily repeat itself. The rallies in 2019 and 2023 also took place against their own macroeconomic backdrops and market cycles.
Still, it’s interesting that $BTC posted solid gains after each of the last two midterm elections.
Will this time follow the historical pattern? I’m more focused on post-election fund flows and whether BTC can hold above $80,000.
History can offer a point of reference, but it shouldn’t be treated as a trading signal. Do you think this will spark a new bull market?
Data source: Yahoo Finance, historical daily data
#美国中期选举:市场有哪些期待? #美国10月非农出炉:降息还有戏吗? #美国正式放行个股永续合约 #特朗普家族支持矿企三季度盈利 #韩国拟设加密安全事件即报规则