Three days of outflows totaling $1.16 billion were portrayed as institutions retreating en masse.
Broken down by day, that’s $643 million, $399 million, and $116 million. By the final day, outflows were less than a fifth of the first day’s.
This wasn’t a retreat; it was the tail end of one.
Look at the final day. Of the $115.56 million in net outflows, BlackRock’s IBIT alone accounted for $95 million. All the other funds combined saw just $20 million leave, while Bitwise and Fidelity still had net inflows over the same period.
So when people say “ETFs are selling,” the subject is really one fund. And one fund accounting for 80% of the outflows shows that “institutions” have never been a monolith.
Net outflows aren’t just a line on a screen. Behind them, authorized participants return shares to the fund in exchange for a basket of bitcoin, then sell those coins on the spot market. Redemptions eventually show up as sell orders affecting the price, but there are a few days in between.
ETF flows are settlement data. They record subscriptions and redemptions that have already happened, not expectations. That means they naturally lag behind price.
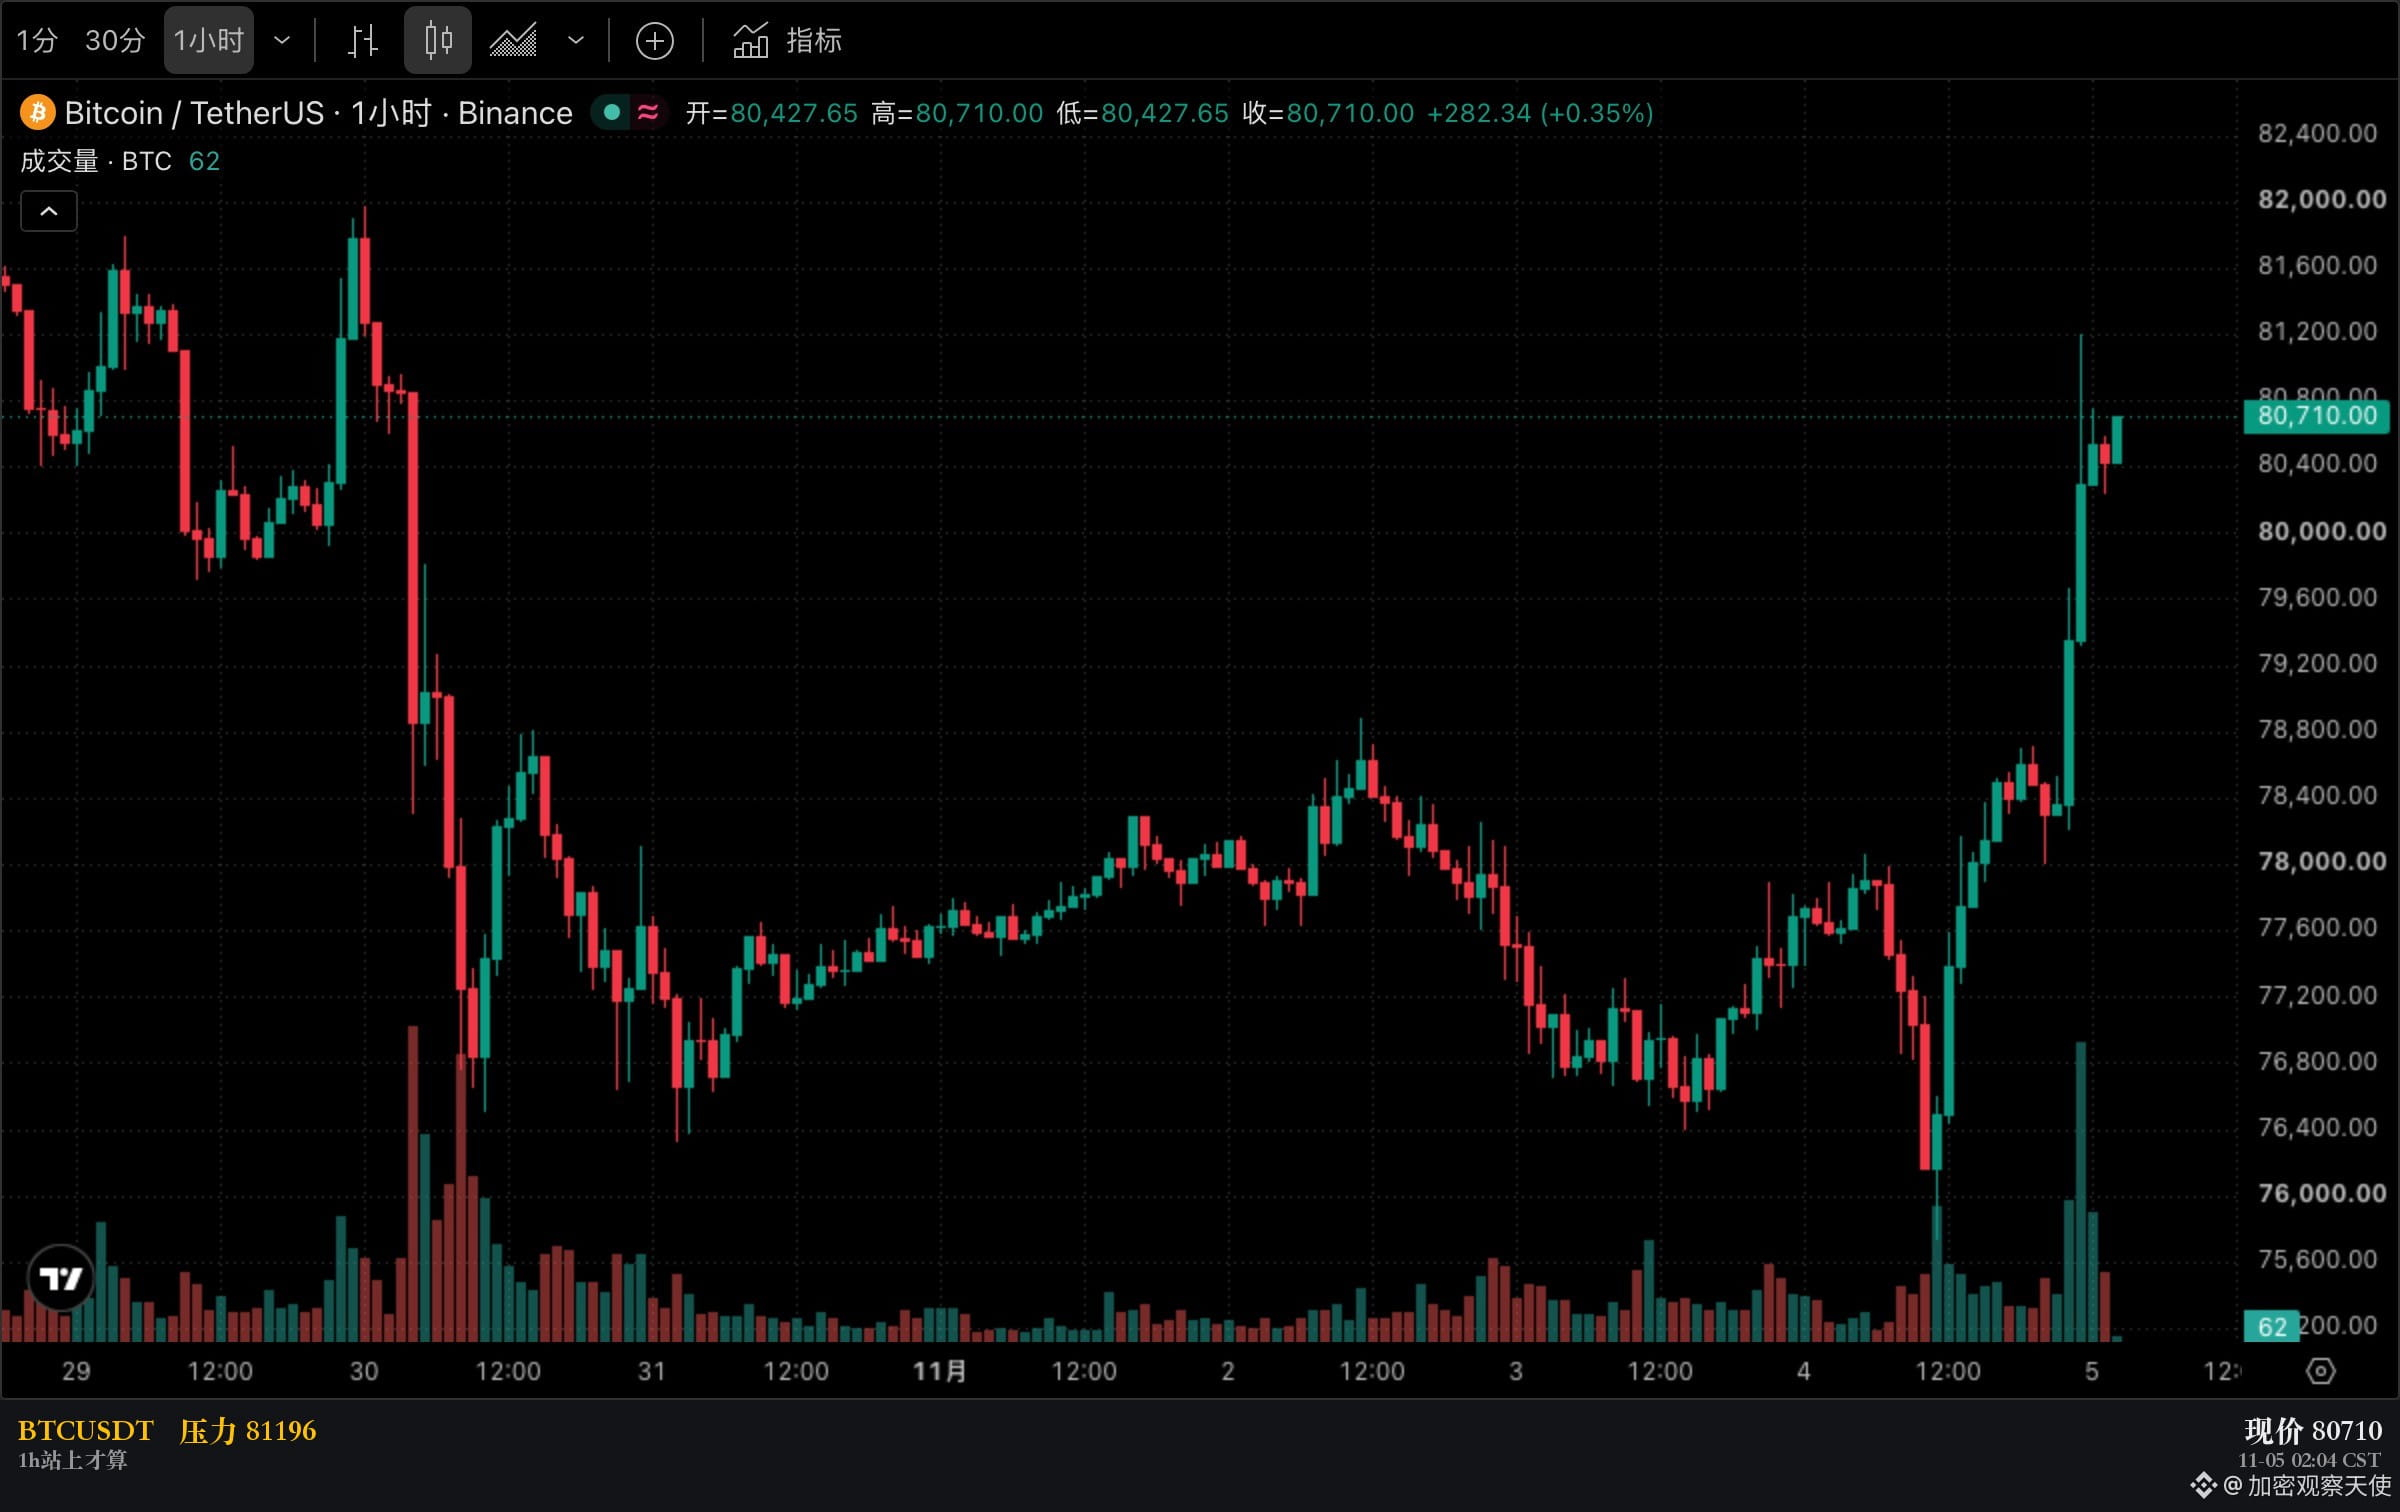
The biggest outflow in those three days came on 10-30, when $643 million left. But the price low of 75736 came five days later, at noon on 11-04.
Use it as a timing signal, and you’ll get the timing wrong.
Lagging doesn’t mean useless. It only means you shouldn’t use it to decide when to enter.
Another interpretation also holds: outflows slowing down may simply mean that everyone who wanted to leave has already left. The data look exactly the same either way. The difference is whether flows pick up again over the next few days.
The point of contention now is 81196. That was the high of the 23:00 hourly candle on 11-04, and the only level in this rebound where volume reached $300 million. Getting above it and holding there would show that real buyers are stepping in after short covering. Failing to break above it and falling back below 78000 would mean this rally is still just a hole left by short covering.
One more thing: $ZEC traded $255 million today, behind SOL and ahead of XRP. To tell whether money is leaving, look at this kind of distribution—not the cumulative outflow figure for three days.
$BTC is now at 80857, up 6.8% from 75736 and just half a percentage point short of 81196. This is a level worth watching at the close, not guessing about.
Do you adjust your ETF position based on flow data or price?
Flows are settlement figures for 11-03, cited from same-day reports by Cointelegraph and news.bitcoin. Firsthand Farside data for this period were unavailable. This is not investment advice.
Broken down by day, that’s $643 million, $399 million, and $116 million. By the final day, outflows were less than a fifth of the first day’s.
This wasn’t a retreat; it was the tail end of one.
Look at the final day. Of the $115.56 million in net outflows, BlackRock’s IBIT alone accounted for $95 million. All the other funds combined saw just $20 million leave, while Bitwise and Fidelity still had net inflows over the same period.
So when people say “ETFs are selling,” the subject is really one fund. And one fund accounting for 80% of the outflows shows that “institutions” have never been a monolith.
Net outflows aren’t just a line on a screen. Behind them, authorized participants return shares to the fund in exchange for a basket of bitcoin, then sell those coins on the spot market. Redemptions eventually show up as sell orders affecting the price, but there are a few days in between.
ETF flows are settlement data. They record subscriptions and redemptions that have already happened, not expectations. That means they naturally lag behind price.
The biggest outflow in those three days came on 10-30, when $643 million left. But the price low of 75736 came five days later, at noon on 11-04.
Use it as a timing signal, and you’ll get the timing wrong.
Lagging doesn’t mean useless. It only means you shouldn’t use it to decide when to enter.
Another interpretation also holds: outflows slowing down may simply mean that everyone who wanted to leave has already left. The data look exactly the same either way. The difference is whether flows pick up again over the next few days.
The point of contention now is 81196. That was the high of the 23:00 hourly candle on 11-04, and the only level in this rebound where volume reached $300 million. Getting above it and holding there would show that real buyers are stepping in after short covering. Failing to break above it and falling back below 78000 would mean this rally is still just a hole left by short covering.
One more thing: $ZEC traded $255 million today, behind SOL and ahead of XRP. To tell whether money is leaving, look at this kind of distribution—not the cumulative outflow figure for three days.
$BTC is now at 80857, up 6.8% from 75736 and just half a percentage point short of 81196. This is a level worth watching at the close, not guessing about.
Do you adjust your ETF position based on flow data or price?
Flows are settlement figures for 11-03, cited from same-day reports by Cointelegraph and news.bitcoin. Firsthand Farside data for this period were unavailable. This is not investment advice.