$BULLA / $XPT / $LSK 30-minute charts are turning bullish in sync, with bullish signals appearing simultaneously 🔥
════════════════════
🔴 $BULLA 30-minute bullish signal
⚠️Technical analysis: ADX(39) indicates a clear trend | MACD DIF has crossed above zero, signaling a bullish trend | EMA5 crossed above EMA8, signaling a short-term bullish shift | KDJ is weak, with bears in control (K: 43.4, D: 43.2) | Volume surge (6.8x)
════════════════════
🔴 $XPT 30-minute bullish signal
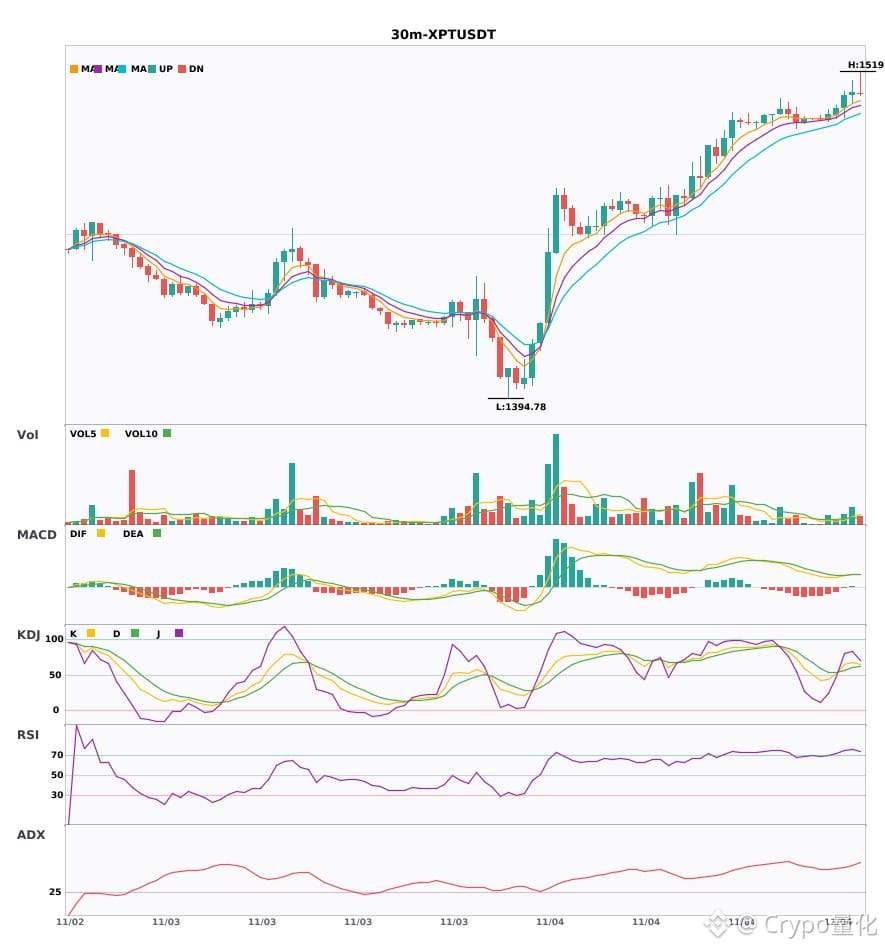
⚠️Technical analysis: ADX(56) indicates a very strong trend (watch out for overbought conditions and a pullback) | MACD golden cross above zero, releasing bullish momentum | EMA5 > EMA8 > EMA13, bullish alignment | KDJ is strong, with bulls in control (K: 67.9, D: 60.6) | Volume increase (2.3x)
════════════════════
🔴 $LSK 30-minute bullish signal
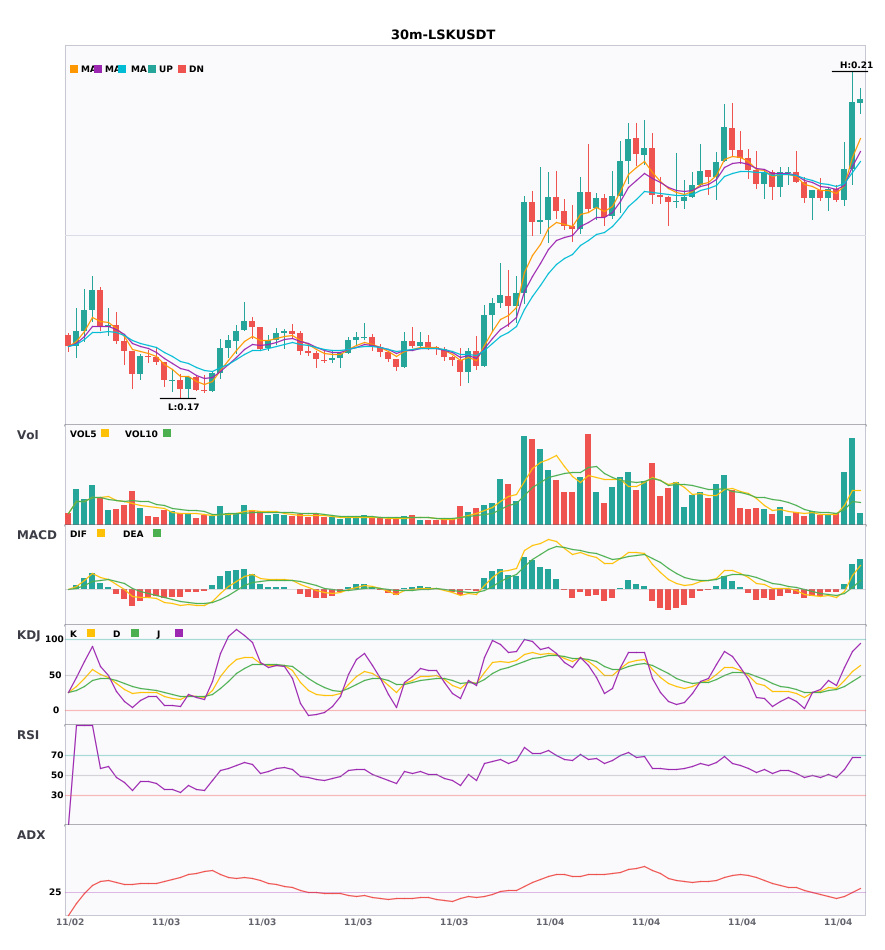
⚠️Technical analysis: ADX(26) indicates a trend is forming; an opportunity to participate | MACD DIF has crossed above zero, signaling a bullish trend | EMA5 crossed above EMA8, signaling a short-term bullish shift | Volume surge (3.7x)
════════════════════
🔔 Follow for first-hand market movement alerts 🔔
#技术分析 #BULLA #XPT #LSK
📌 When trading, pay attention to whether the candlestick pattern confirms the signal
════════════════════
🔴 $BULLA 30-minute bullish signal
⚠️Technical analysis: ADX(39) indicates a clear trend | MACD DIF has crossed above zero, signaling a bullish trend | EMA5 crossed above EMA8, signaling a short-term bullish shift | KDJ is weak, with bears in control (K: 43.4, D: 43.2) | Volume surge (6.8x)
════════════════════
🔴 $XPT 30-minute bullish signal
⚠️Technical analysis: ADX(56) indicates a very strong trend (watch out for overbought conditions and a pullback) | MACD golden cross above zero, releasing bullish momentum | EMA5 > EMA8 > EMA13, bullish alignment | KDJ is strong, with bulls in control (K: 67.9, D: 60.6) | Volume increase (2.3x)
════════════════════
🔴 $LSK 30-minute bullish signal
⚠️Technical analysis: ADX(26) indicates a trend is forming; an opportunity to participate | MACD DIF has crossed above zero, signaling a bullish trend | EMA5 crossed above EMA8, signaling a short-term bullish shift | Volume surge (3.7x)
════════════════════
🔔 Follow for first-hand market movement alerts 🔔
#技术分析 #BULLA #XPT #LSK
📌 When trading, pay attention to whether the candlestick pattern confirms the signal