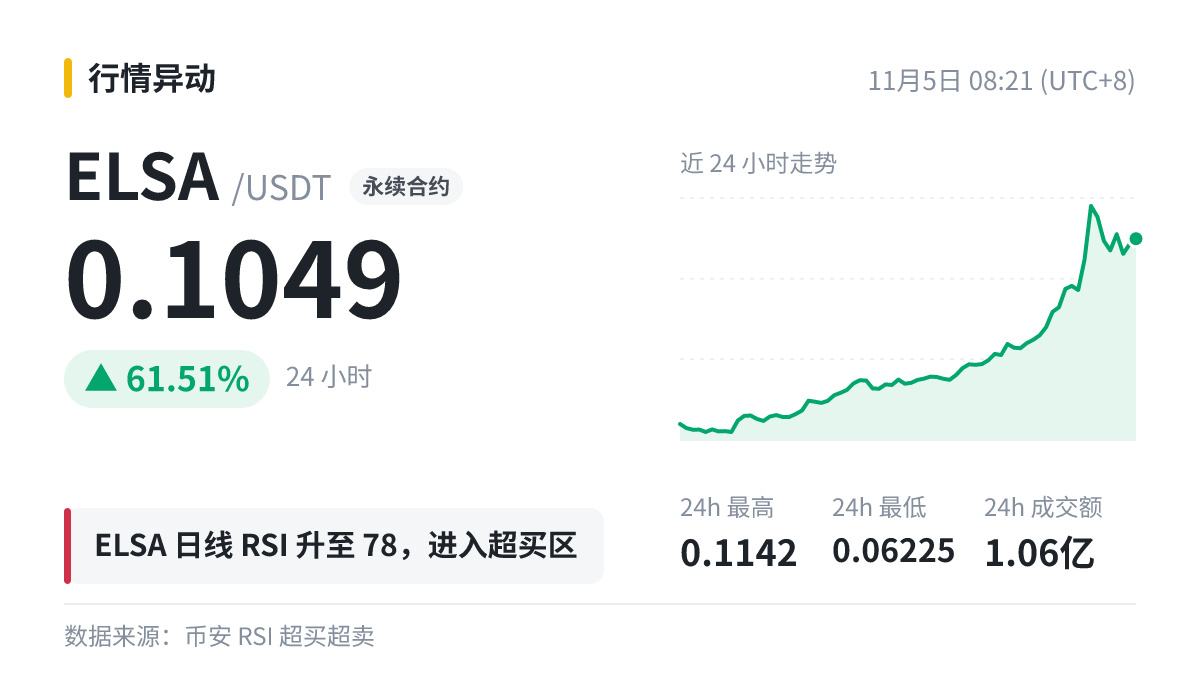
🧭 Data: $ELSA |Daily RSI(14) 78.3|Overbought
· Interpretation: RSI 50 is often viewed as the dividing line between strength and weakness: staying above 50 over the long term indicates that upward momentum is dominant; below 50, the opposite is true.
· How to read it: During a one-way rally, RSI can remain above 70 for a long time; during a one-way decline, it can likewise stay below 30 for a long time. Overbought or oversold readings don’t mean an immediate reversal.
Extreme readings often signal greater volatility. At times like these, it’s better to reduce leverage rather than increase your position.
· Interpretation: RSI 50 is often viewed as the dividing line between strength and weakness: staying above 50 over the long term indicates that upward momentum is dominant; below 50, the opposite is true.
· How to read it: During a one-way rally, RSI can remain above 70 for a long time; during a one-way decline, it can likewise stay below 30 for a long time. Overbought or oversold readings don’t mean an immediate reversal.
Extreme readings often signal greater volatility. At times like these, it’s better to reduce leverage rather than increase your position.