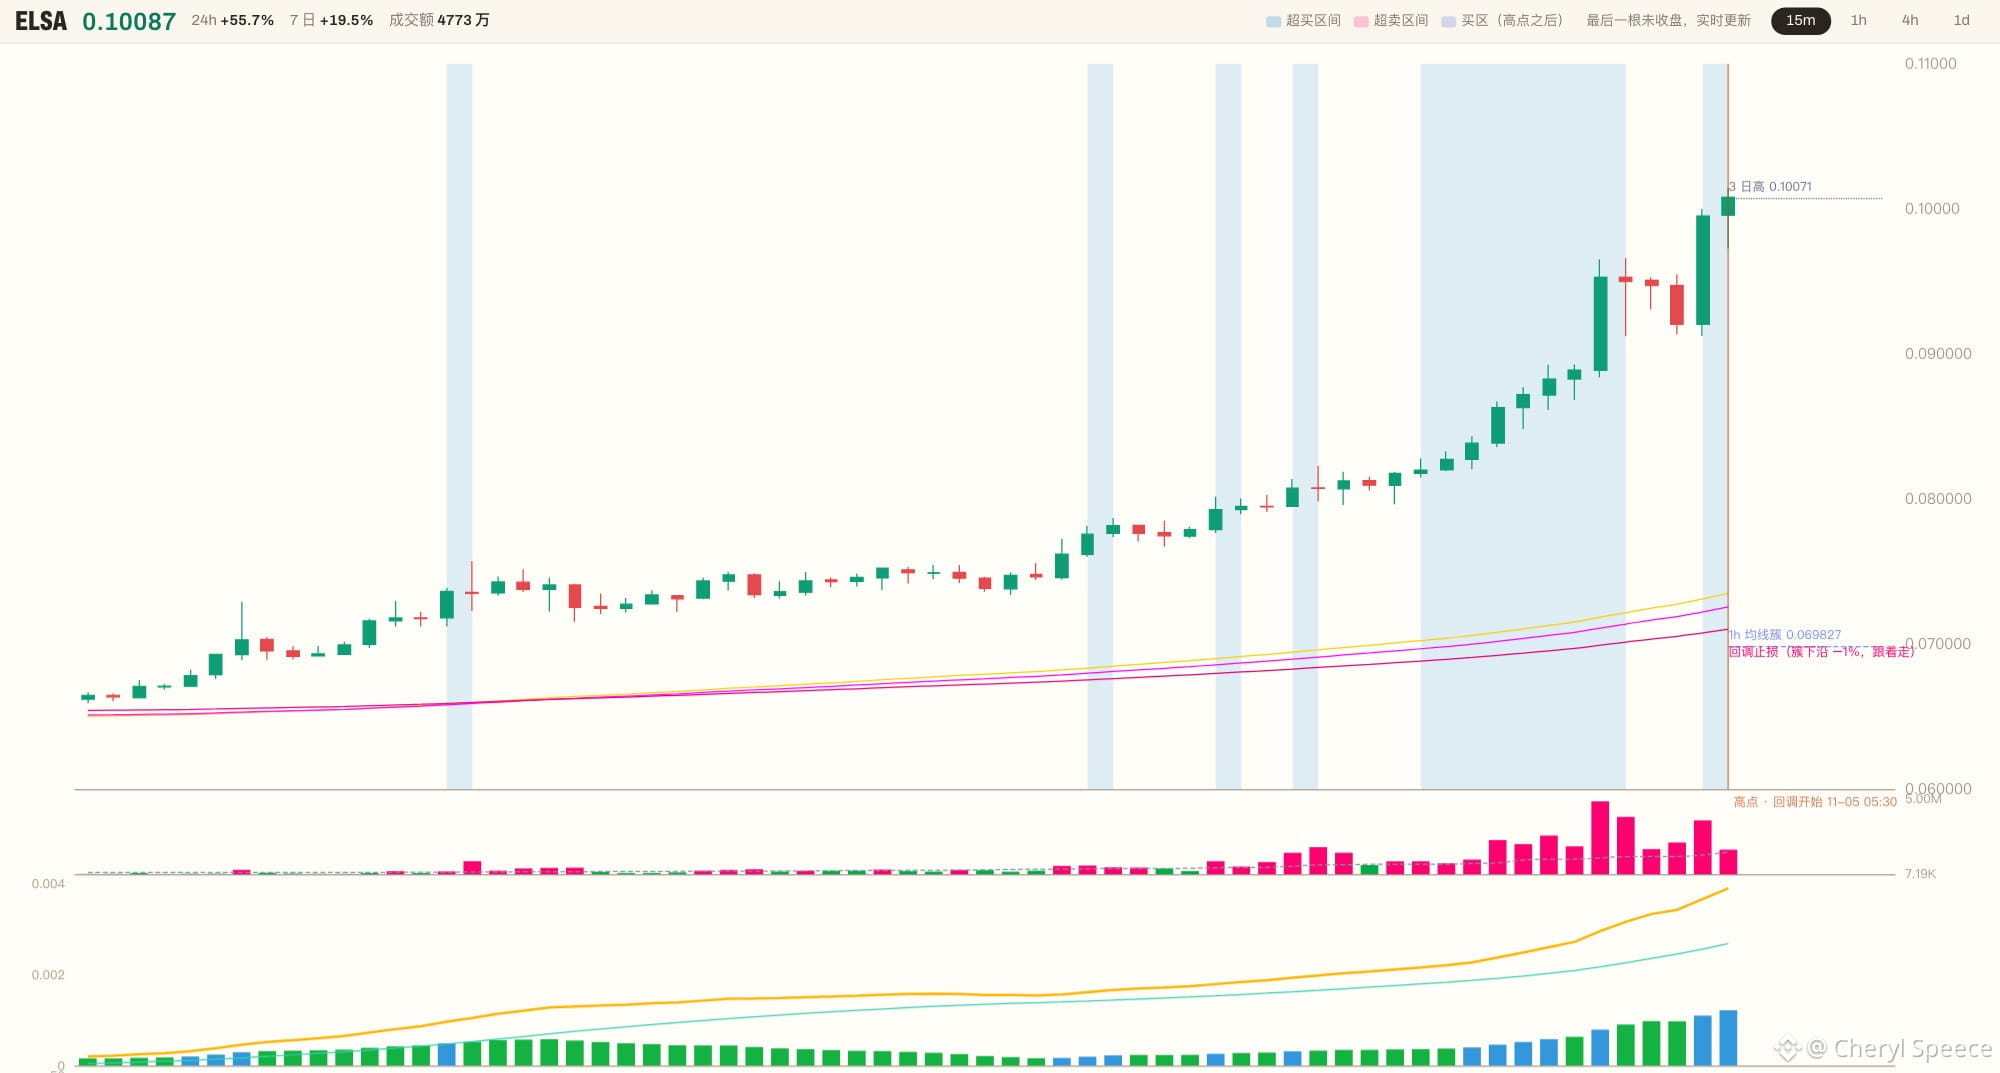
😤 23.29x volume. One big 15m bullish candle broke straight through 0.0966, which had capped price for 48 candles, and closed at 0.099510.
$ELSA closed at the 94% mark of its candle range, almost right at the high.
🔥 But when I lay out the conditions, only four of the seven light up. RSI 83.0, CCI 271, and price is +36.10% above the moving-average cluster. In the last 32 candles, 16 were overbought.
💀 On one side, a high-volume breakout above the previous high with a strong close; on the other, the bearish alignment still accounts for 45% of the last 96 candles. This is a rebound within a 1h downtrend, while the 1d trend still leans bearish. The five timeframes show a 17-to-2 bullish consensus, but the 1h gate hasn’t given me the green light.
👀 So I’m not opening a position. I’m not chasing this big green candle. I’ll wait to see if price pulls back without falling below the top of the moving-average cluster at 0.073118, and if the 1h trend stabilizes, then I’ll consider going long. For now, I’m watching.
⚡ 0.099510 is the price right in front of us; 0.073118 is the line I’ve drawn—will volume keep pushing it higher, or will this spike pull back first?
Here are the three charts. Are you betting on another push, or a drop back toward 0.073118? Pick a side in the comments. 🤔
#ETH #BTC $ETH $BTC
$ELSA closed at the 94% mark of its candle range, almost right at the high.
🔥 But when I lay out the conditions, only four of the seven light up. RSI 83.0, CCI 271, and price is +36.10% above the moving-average cluster. In the last 32 candles, 16 were overbought.
💀 On one side, a high-volume breakout above the previous high with a strong close; on the other, the bearish alignment still accounts for 45% of the last 96 candles. This is a rebound within a 1h downtrend, while the 1d trend still leans bearish. The five timeframes show a 17-to-2 bullish consensus, but the 1h gate hasn’t given me the green light.
👀 So I’m not opening a position. I’m not chasing this big green candle. I’ll wait to see if price pulls back without falling below the top of the moving-average cluster at 0.073118, and if the 1h trend stabilizes, then I’ll consider going long. For now, I’m watching.
⚡ 0.099510 is the price right in front of us; 0.073118 is the line I’ve drawn—will volume keep pushing it higher, or will this spike pull back first?
Here are the three charts. Are you betting on another push, or a drop back toward 0.073118? Pick a side in the comments. 🤔
#ETH #BTC $ETH $BTC