LONG $APT | Is 1h momentum heating up or has it cooled off?
🚨 AI TRADE ALERT — $APT
🟢 LONG
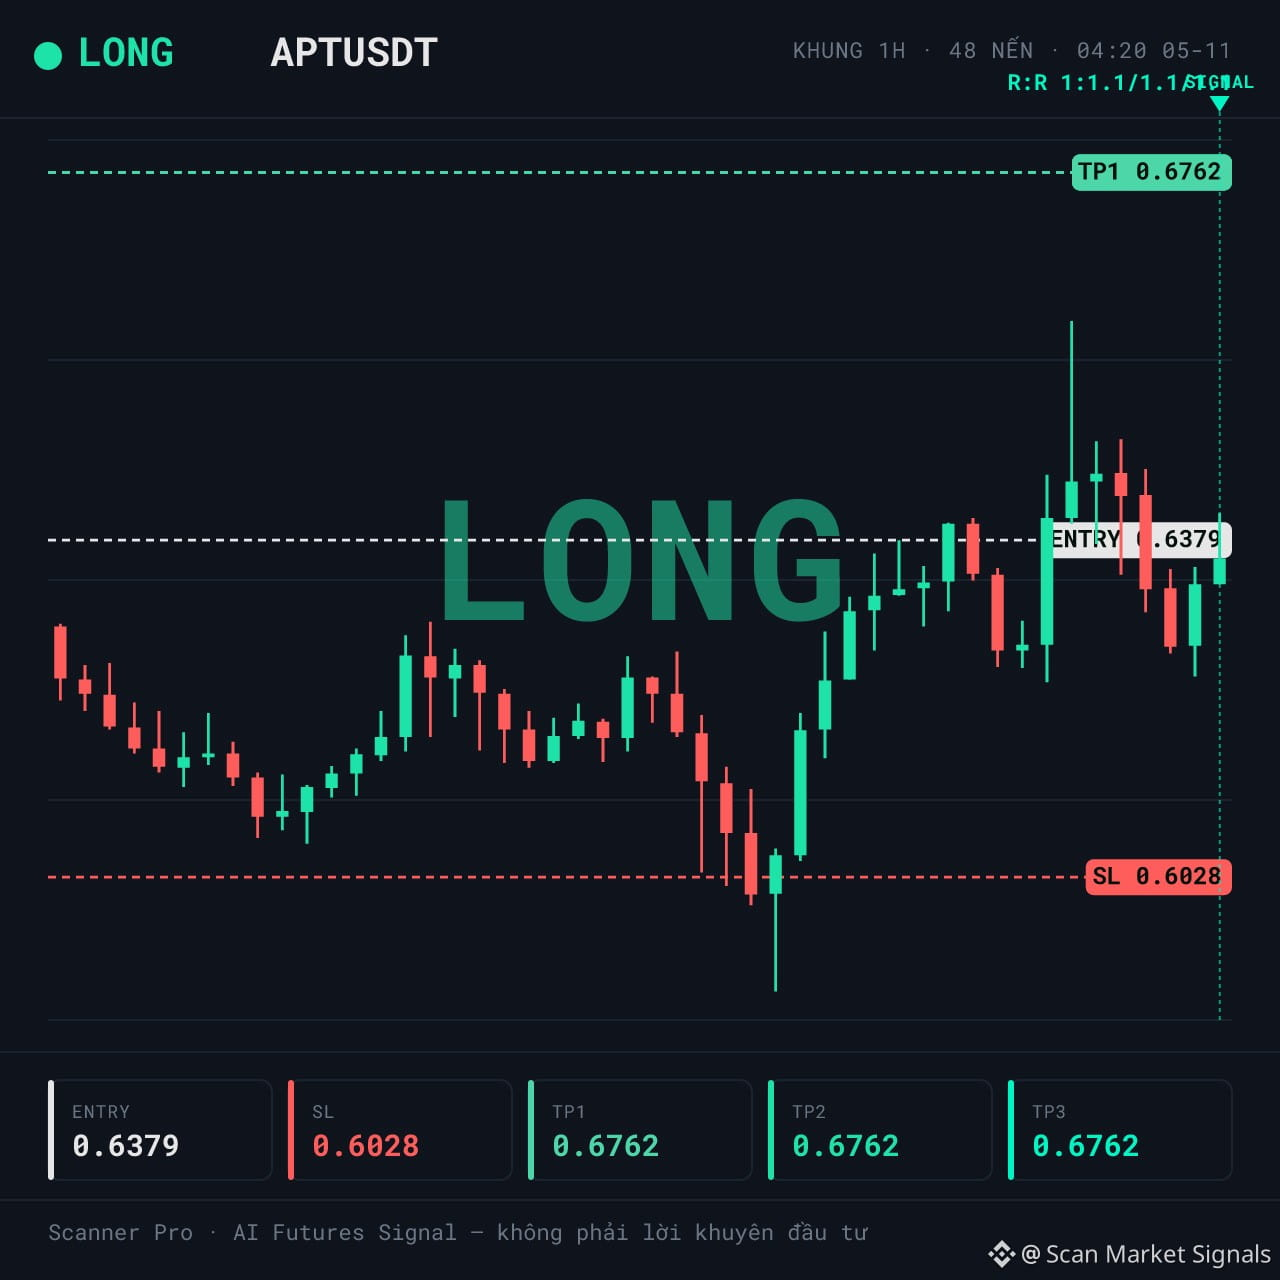
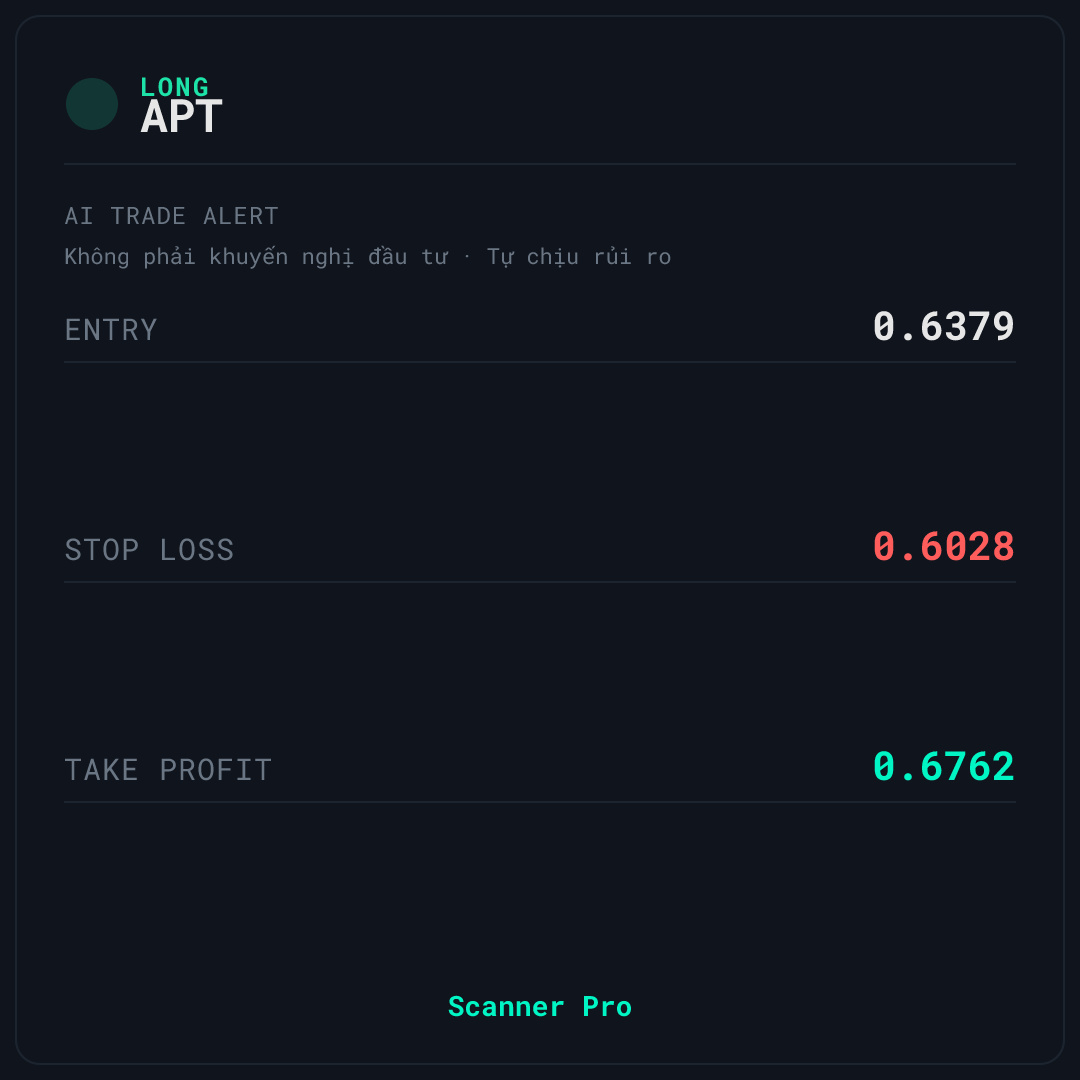
📌 Entry: 0.6369 – 0.6389
🛑 Stop Loss: 0.6028
🎯 Take Profit: 0.6762
⏰ Valid for: 6 hours (04:20 – 10:20 VN) - Date: 05/11
↔️ SIDEWAYS — the market is moving sideways, with a fade (mean-reversion) signal
$APT is being monitored by Scanner Pro for a LONG scenario as long as the price holds above the short-term EMA zone. The market context is classified as sideways, with a classification confidence of 55, while the volume spike is only 0.64x.
📊 WHAT THE DATA IS SHOWING
The LONG signal appears while the price is at 67% of its 24h range—not at the low end, but not at the high either. 1h momentum is at 56.6, neutral and not overheated. Liquidity is rated high, with 24h volume of approximately 46,421,694 in the quote asset, but the volume spike of just 0.64x suggests participation has not surged. Funding at 0.0100% shows that LONGs are paying SHORTs, meaning the crowd is leaning in the same direction as the signal—an adverse factor to keep in mind.
💡 SCENARIO & OPEN QUESTION — $APT
🚫 Biggest risk: the price is in the upper part of its 24h range (67%), while the market is moving sideways and volume has not confirmed the move—this could easily turn into a bull trap if buying pressure does not persist. In addition, positive funding indicates that LONGs are crowded and paying fees, increasing the risk of a pullback. If the price closes below the stop-loss level shown on the signal card, the current LONG scenario is no longer valid. Do you think this is a setup for a breakout or just a technical reaction within a sideways range?
This technical analysis is for educational purposes and is not investment advice. Cryptocurrency trading carries high risk, and you could lose all your capital. Do your own research and take responsibility for your decisions.
#Binance #Crypto #Futures
🚨 AI TRADE ALERT — $APT
🟢 LONG
📌 Entry: 0.6369 – 0.6389
🛑 Stop Loss: 0.6028
🎯 Take Profit: 0.6762
⏰ Valid for: 6 hours (04:20 – 10:20 VN) - Date: 05/11
↔️ SIDEWAYS — the market is moving sideways, with a fade (mean-reversion) signal
$APT is being monitored by Scanner Pro for a LONG scenario as long as the price holds above the short-term EMA zone. The market context is classified as sideways, with a classification confidence of 55, while the volume spike is only 0.64x.
📊 WHAT THE DATA IS SHOWING
The LONG signal appears while the price is at 67% of its 24h range—not at the low end, but not at the high either. 1h momentum is at 56.6, neutral and not overheated. Liquidity is rated high, with 24h volume of approximately 46,421,694 in the quote asset, but the volume spike of just 0.64x suggests participation has not surged. Funding at 0.0100% shows that LONGs are paying SHORTs, meaning the crowd is leaning in the same direction as the signal—an adverse factor to keep in mind.
💡 SCENARIO & OPEN QUESTION — $APT
🚫 Biggest risk: the price is in the upper part of its 24h range (67%), while the market is moving sideways and volume has not confirmed the move—this could easily turn into a bull trap if buying pressure does not persist. In addition, positive funding indicates that LONGs are crowded and paying fees, increasing the risk of a pullback. If the price closes below the stop-loss level shown on the signal card, the current LONG scenario is no longer valid. Do you think this is a setup for a breakout or just a technical reaction within a sideways range?
This technical analysis is for educational purposes and is not investment advice. Cryptocurrency trading carries high risk, and you could lose all your capital. Do your own research and take responsibility for your decisions.
#Binance #Crypto #Futures