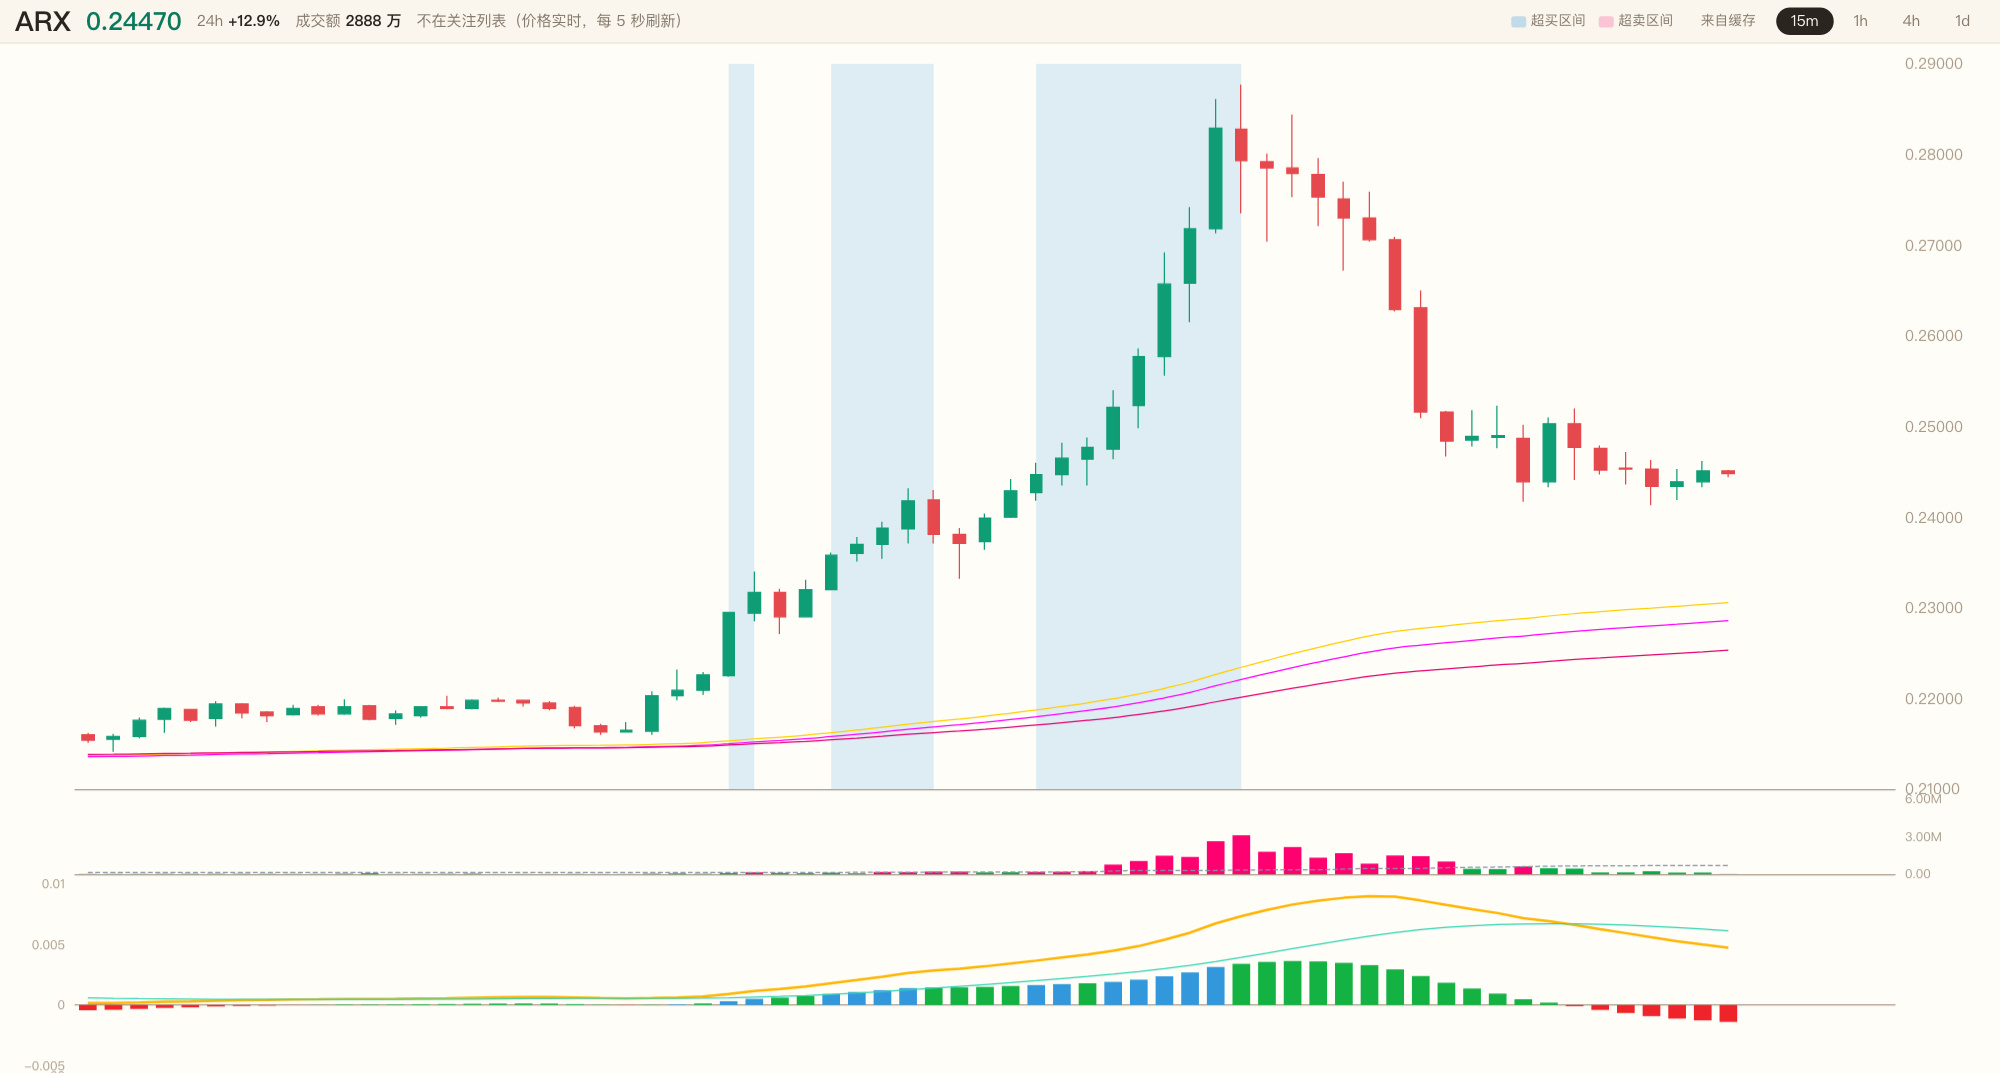
😤 0.24510. 152x volume—a single candle punched straight through the ceiling formed by long-term bears. This isn’t a recovery that ground its way up slowly; someone’s pouring it in by the bucket.
$ARX Fifteen minutes in, the price is already +6.39% above the moving-average cluster, plunging headfirst into overbought territory.
🔥 Here’s the bull-bear picture: on one side, a high-volume breakout above the previous 48 candles’ highs, with the close at 78% of the candle’s range; on the other, a rebound while the 1h trend is still bearish, and the 4h chart is all tangled up. The bulls score +10—looks intimidating.
💀 But I only count three out of seven criteria. RSI 88.9, CCI 408, and more than 27% above the cluster. This isn’t a takeoff with the trend; it’s chasing the wind at high altitude.
👀 So I’m not opening a single position. I’ll wait for a pullback that holds above the top of the moving-average cluster at 0.23037, and for the 1h chart to stabilize above it before considering a long. For now, just watching.
⚡ 0.24510 is the price right in front of us; 0.23037 is the line I’ve drawn—will it pull back and hold first, or will this momentum fizzle out completely?
Here are the three charts. Are you betting it’ll ride the volume and push higher, or spike up first and then pull back? Pick a side in the comments. 🤔
#ETH #BTC $ETH $BTC
$ARX Fifteen minutes in, the price is already +6.39% above the moving-average cluster, plunging headfirst into overbought territory.
🔥 Here’s the bull-bear picture: on one side, a high-volume breakout above the previous 48 candles’ highs, with the close at 78% of the candle’s range; on the other, a rebound while the 1h trend is still bearish, and the 4h chart is all tangled up. The bulls score +10—looks intimidating.
💀 But I only count three out of seven criteria. RSI 88.9, CCI 408, and more than 27% above the cluster. This isn’t a takeoff with the trend; it’s chasing the wind at high altitude.
👀 So I’m not opening a single position. I’ll wait for a pullback that holds above the top of the moving-average cluster at 0.23037, and for the 1h chart to stabilize above it before considering a long. For now, just watching.
⚡ 0.24510 is the price right in front of us; 0.23037 is the line I’ve drawn—will it pull back and hold first, or will this momentum fizzle out completely?
Here are the three charts. Are you betting it’ll ride the volume and push higher, or spike up first and then pull back? Pick a side in the comments. 🤔
#ETH #BTC $ETH $BTC