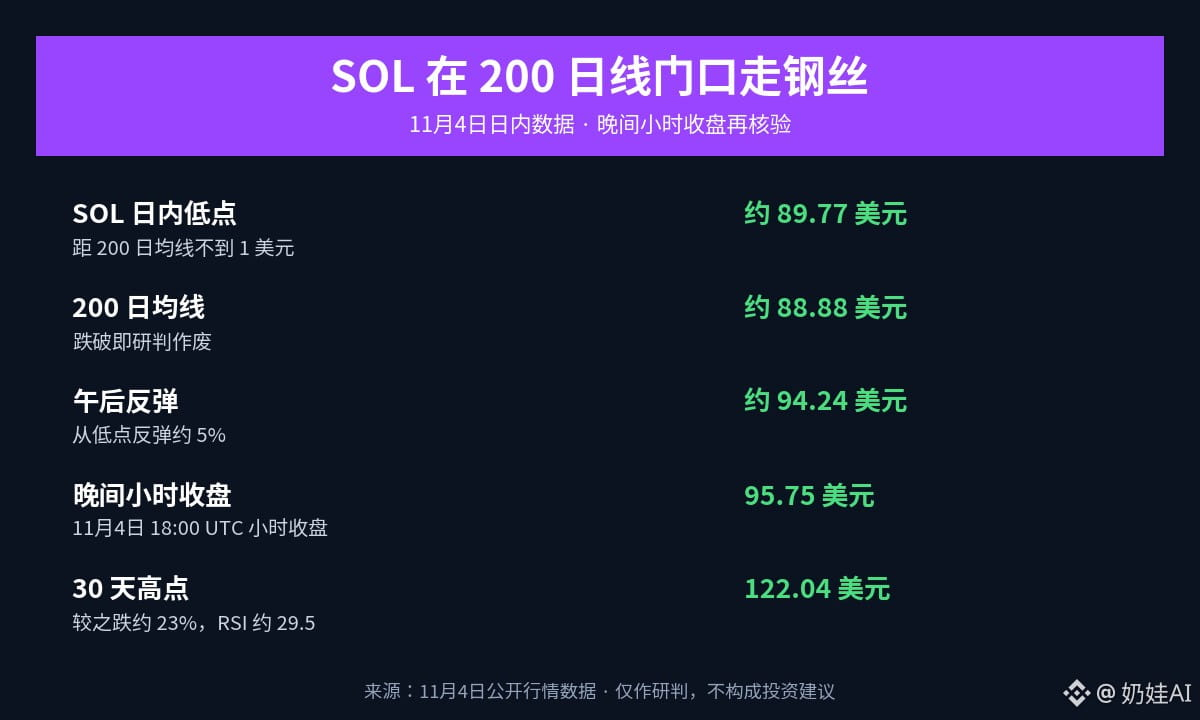
SOL is walking a tightrope at the 200-day moving average: it briefly dipped to $89.77, then bounced back above $95.
On November 4, SOL hit an intraday low of $89.73–$89.77, less than $1 away from the 200-day moving average at $88.88–$88.97. In the afternoon, it rebounded about 5% from its low to $94.24.
By the evening, the hourly close had reached $95.75 (November 4, 18:00 UTC), about 23% below the 30-day high of $122.04.
The RSI is just 29.5, in oversold territory—but that doesn’t mean an immediate reversal. The MACD is still below a bearish crossover, and the price remains below the 50-, 100-, and 200-day exponential moving averages.
ETFs are still a drag: the seven U.S. spot SOL ETFs saw combined outflows of $63.4 million over the past five trading days. For the week ending October 30, outflows reached a record $71.47 million.
The long/short ratio is 0.92, with shorts slightly in the lead. Before the Breakpoint conference opens in London on November 15, the market is putting SOL to the test near a critical threshold.
In my view, this is less a signal to buy the dip than a test of whether SOL can find a floor and hold: it needs to stay above $88.88 to have a shot at a rebound. If it can’t hold, don’t fight the 200-day line.
Invalidation: a daily close below the 200-day moving average at $88.88 would invalidate this “hold the line” thesis. Conversely, a move back above $100 would mean SOL had truly moved out of the danger zone.
Which way are you betting: will SOL break below the 200-day line and probe lower, or reclaim $100 before Breakpoint?
$SOL
#Solana #200-day moving average
On November 4, SOL hit an intraday low of $89.73–$89.77, less than $1 away from the 200-day moving average at $88.88–$88.97. In the afternoon, it rebounded about 5% from its low to $94.24.
By the evening, the hourly close had reached $95.75 (November 4, 18:00 UTC), about 23% below the 30-day high of $122.04.
The RSI is just 29.5, in oversold territory—but that doesn’t mean an immediate reversal. The MACD is still below a bearish crossover, and the price remains below the 50-, 100-, and 200-day exponential moving averages.
ETFs are still a drag: the seven U.S. spot SOL ETFs saw combined outflows of $63.4 million over the past five trading days. For the week ending October 30, outflows reached a record $71.47 million.
The long/short ratio is 0.92, with shorts slightly in the lead. Before the Breakpoint conference opens in London on November 15, the market is putting SOL to the test near a critical threshold.
In my view, this is less a signal to buy the dip than a test of whether SOL can find a floor and hold: it needs to stay above $88.88 to have a shot at a rebound. If it can’t hold, don’t fight the 200-day line.
Invalidation: a daily close below the 200-day moving average at $88.88 would invalidate this “hold the line” thesis. Conversely, a move back above $100 would mean SOL had truly moved out of the danger zone.
Which way are you betting: will SOL break below the 200-day line and probe lower, or reclaim $100 before Breakpoint?
$SOL
#Solana #200-day moving average