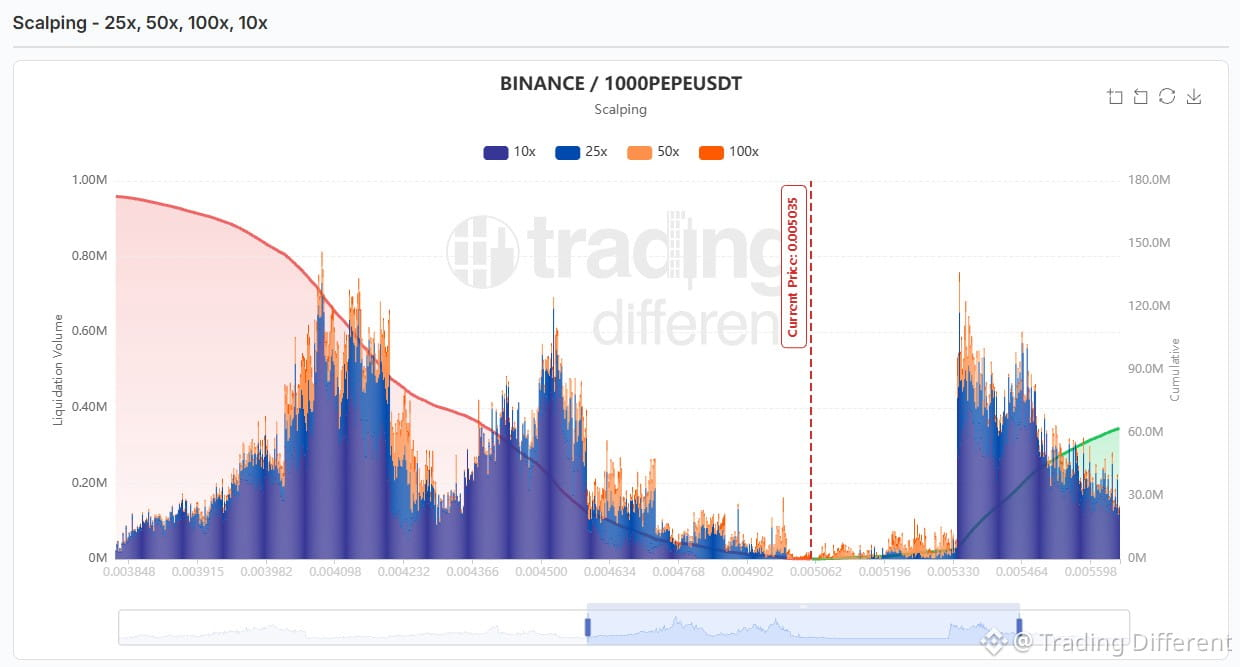
#PEPE | PEPE liquidation map for scalping (1000PEPEUSDT)
Current price: 0.005035
🔴 Shorts exposed above:
0.00506–0.00530: thin pockets of 50x and 100x, close to the price 0.00533–0.00560: the strongest cluster above, with a peak near 0.00532, at ~6%
🟢 Longs exposed below:
0.00470–0.00500: thin bands of 50x and 100x 0.00440–0.00460: an intermediate cluster, with a peak near 0.00450, at ~10% 0.00400–0.00420: the highest peak on the entire map, near 0.00410, at ~19% 0.00385–0.00398: a lighter base of 10x and 25x
🔥 The accumulated liquidations of longs below are about 3 times those of shorts above. Still, the nearest strong concentration is the shorts cluster above.
The map does not indicate the price direction. It shows where leveraged positions would be liquidated if the price reached those levels.
👉 tradingdifferent.com/es/dashboard/liquidation-heatmap?code=binance-square
Current price: 0.005035
🔴 Shorts exposed above:
0.00506–0.00530: thin pockets of 50x and 100x, close to the price 0.00533–0.00560: the strongest cluster above, with a peak near 0.00532, at ~6%
🟢 Longs exposed below:
0.00470–0.00500: thin bands of 50x and 100x 0.00440–0.00460: an intermediate cluster, with a peak near 0.00450, at ~10% 0.00400–0.00420: the highest peak on the entire map, near 0.00410, at ~19% 0.00385–0.00398: a lighter base of 10x and 25x
🔥 The accumulated liquidations of longs below are about 3 times those of shorts above. Still, the nearest strong concentration is the shorts cluster above.
The map does not indicate the price direction. It shows where leveraged positions would be liquidated if the price reached those levels.
👉 tradingdifferent.com/es/dashboard/liquidation-heatmap?code=binance-square