$SOL (SOL) Short Technical Analysis
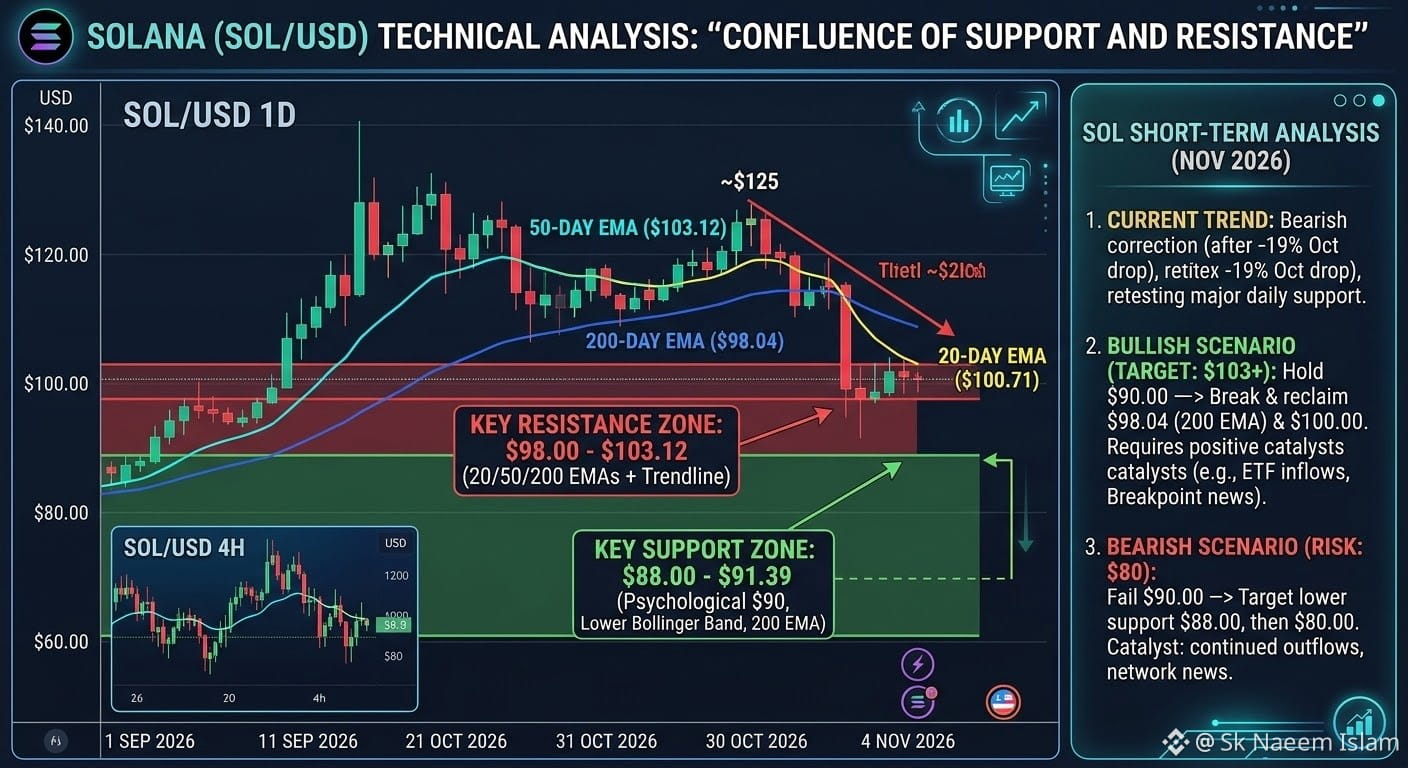
Solana (SOL) is trading around the $91 – $94 region, facing sustained downward pressure after sliding roughly 19% over the past month.
Key Technical Levels & Candlestick Insights
Critical Support Zone ($88.50 – $89.00): Recent daily candles show strong downside tests near the 200-day moving average (around $88.80). This zone represents a crucial psychological and structural floor; a breakdown below this line risks triggering accelerated selling toward secondary support at $78.35.
Intraday Rebound Action: Price action recently wicked down to test the $89.70 area before a bullish defense stepped in to push SOL back toward $94, forming a long lower shadow on the daily candle—an indication of buying interest on dips.
Overhead Resistance: Moving averages remain stacked overhead acting as resistance barriers. Immediate hurdles lie around $97.80 to $99.60 (confluent with short-term moving averages), followed by a stiffer cap near $102.75 (50-day EMA).
Outlook
The broader structure on the daily timeframe remains cautious/bearish as long as SOL trades below its key moving average clusters. Bulls need a high-volume daily close above $100 to invalidate the current downward bias and signal a potential trend reversal.
#solana #SolanaStrong #Binance98PercentReplenished #USOctoberNFP-AreRateCutsStillPossible #AMDBeatsExpectations-AINarrativeContinues
Solana (SOL) is trading around the $91 – $94 region, facing sustained downward pressure after sliding roughly 19% over the past month.
Key Technical Levels & Candlestick Insights
Critical Support Zone ($88.50 – $89.00): Recent daily candles show strong downside tests near the 200-day moving average (around $88.80). This zone represents a crucial psychological and structural floor; a breakdown below this line risks triggering accelerated selling toward secondary support at $78.35.
Intraday Rebound Action: Price action recently wicked down to test the $89.70 area before a bullish defense stepped in to push SOL back toward $94, forming a long lower shadow on the daily candle—an indication of buying interest on dips.
Overhead Resistance: Moving averages remain stacked overhead acting as resistance barriers. Immediate hurdles lie around $97.80 to $99.60 (confluent with short-term moving averages), followed by a stiffer cap near $102.75 (50-day EMA).
Outlook
The broader structure on the daily timeframe remains cautious/bearish as long as SOL trades below its key moving average clusters. Bulls need a high-volume daily close above $100 to invalidate the current downward bias and signal a potential trend reversal.
#solana #SolanaStrong #Binance98PercentReplenished #USOctoberNFP-AreRateCutsStillPossible #AMDBeatsExpectations-AINarrativeContinues