
赚到就收手
276 Posts

赚到就收手
Report
Block User
每日ETH BTC分析
39 Following
109 Followers
30 Liked
Posts
All
Quotes
·
--
$ETH Ethereum traded in a narrow range of $2,200–$2,280 over the past five complete trading days. Today, following the conclusion of the U.S. midterm elections, a weaker dollar and short covering drove it up from $2,274.5 to around $2,429.4, a gain of 6.81%. Continued ETF redemptions remain a headwind over the medium term; whether the rebound can hold above $2,400 depends on whether fund flows reverse.
Price action:
Closed at $2,243.5 on October 30, down 0.36%. The market continued to digest fears following a security incident at a major exchange, compounded by net outflows of about $156 million from spot ETFs.
Closed at $2,254.8 on October 31, up 0.50%.
Closed at $2,274.6 on November 1, up 0.87%.
Closed at $2,252.5 on November 2, down 0.98%. Spot ETFs saw net outflows of about $140 million, with BlackRock's ETHA accounting for nearly all redemptions that day.
Closed at $2,274.5 on November 3, up 0.97%.
Opened at $2,274.5 today; latest price: $2,429.4, up 6.81%.
Main drivers:
1. Conclusion of the midterm elections and unwinding of hedges. After the election results were finalized, the U.S. Dollar Index fell and the 10-year Treasury yield declined. Pre-election hedges were unwound en masse, lifting risk assets broadly. Ethereum rallied from around $2,274.5 to around $2,429.4, significantly outperforming Bitcoin's roughly 4% rebound over the same period and briefly moving above $2,400.
2. Continued spot ETF redemptions. Net outflows totaled about $1.61 billion in October. Outflows on October 30, November 2 and November 3 were about $156 million, $140 million and $85.3 million, respectively. BlackRock's ETHA accounted for most of the selling pressure, and the fund's net assets fell from about $17.7 billion in early October to around $13.3 billion.
3. Aftermath of the exchange security incident. The October 29 incident led to the theft of about 200,000 Ethereum-related assets and the liquidation of roughly $1.5 billion in positions across the market. The price briefly fell to around $2,170. Since then, companies such as BitMine have made modest additions to their treasury holdings, but these have been insufficient to offset ETF selling pressure.
4. Short liquidations amplified the rebound. In the roughly two hours after U.S. equities opened on November 4, about $236 million in Ethereum-related contracts were liquidated, including roughly $132 million in short positions. The price surged from an intraday low of around $2,226 to near $2,450, triggering a short squeeze.
Summary: From October 30 to November 3, Ethereum fluctuated around $2,250 amid the lingering effects of the security incident and continued ETF redemptions, with daily moves of less than 1% in either direction. Today, after the election results became clear, a weaker dollar and improved risk appetite, combined with short liquidations, drove the price rapidly up from its opening level of $2,274.5 to around $2,429.4. It gained 6.81% intraday, outperforming Bitcoin for the period. Modest corporate treasury buying has provided some support, but fund redemptions have yet to reverse, so a sustained rebound will still require supportive fund flows. For short-term trading, the local engine's structure is bullish, favoring limit orders and waiting for a deep pullback: entry reference around $2,265, stop-loss at $2,263, target at $2,448, reference leverage of 5x, and 70% confidence.
What to watch next: Whether spot Ethereum ETFs can end seven consecutive days of net outflows and turn to net inflows; whether the price can hold the $2,300–$2,350 area as sentiment fades; and whether delays to the Glamsterdam testnet will continue to weigh on the upgrade narrative.
#ETH #ETH Price Analysis
$ETH Ethereum traded in a narrow range of $2,200–$2,280 over the past five complete trading days. Today, following the conclusion of the U.S. midterm elections, a weaker dollar and short covering drove it up from $2,274.5 to around $2,429.4, a gain of 6.81%. Continued ETF redemptions remain a headwind over the medium term; whether the rebound can hold above $2,400 depends on whether fund flows reverse.
Price action:
Closed at $2,243.5 on October 30, down 0.36%. The market continued to digest fears following a security incident at a major exchange, compounded by net outflows of about $156 million from spot ETFs.
Closed at $2,254.8 on October 31, up 0.50%.
Closed at $2,274.6 on November 1, up 0.87%.
Closed at $2,252.5 on November 2, down 0.98%. Spot ETFs saw net outflows of about $140 million, with BlackRock's ETHA accounting for nearly all redemptions that day.
Closed at $2,274.5 on November 3, up 0.97%.
Opened at $2,274.5 today; latest price: $2,429.4, up 6.81%.
Main drivers:
1. Conclusion of the midterm elections and unwinding of hedges. After the election results were finalized, the U.S. Dollar Index fell and the 10-year Treasury yield declined. Pre-election hedges were unwound en masse, lifting risk assets broadly. Ethereum rallied from around $2,274.5 to around $2,429.4, significantly outperforming Bitcoin's roughly 4% rebound over the same period and briefly moving above $2,400.
2. Continued spot ETF redemptions. Net outflows totaled about $1.61 billion in October. Outflows on October 30, November 2 and November 3 were about $156 million, $140 million and $85.3 million, respectively. BlackRock's ETHA accounted for most of the selling pressure, and the fund's net assets fell from about $17.7 billion in early October to around $13.3 billion.
3. Aftermath of the exchange security incident. The October 29 incident led to the theft of about 200,000 Ethereum-related assets and the liquidation of roughly $1.5 billion in positions across the market. The price briefly fell to around $2,170. Since then, companies such as BitMine have made modest additions to their treasury holdings, but these have been insufficient to offset ETF selling pressure.
4. Short liquidations amplified the rebound. In the roughly two hours after U.S. equities opened on November 4, about $236 million in Ethereum-related contracts were liquidated, including roughly $132 million in short positions. The price surged from an intraday low of around $2,226 to near $2,450, triggering a short squeeze.
Summary: From October 30 to November 3, Ethereum fluctuated around $2,250 amid the lingering effects of the security incident and continued ETF redemptions, with daily moves of less than 1% in either direction. Today, after the election results became clear, a weaker dollar and improved risk appetite, combined with short liquidations, drove the price rapidly up from its opening level of $2,274.5 to around $2,429.4. It gained 6.81% intraday, outperforming Bitcoin for the period. Modest corporate treasury buying has provided some support, but fund redemptions have yet to reverse, so a sustained rebound will still require supportive fund flows. For short-term trading, the local engine's structure is bullish, favoring limit orders and waiting for a deep pullback: entry reference around $2,265, stop-loss at $2,263, target at $2,448, reference leverage of 5x, and 70% confidence.
What to watch next: Whether spot Ethereum ETFs can end seven consecutive days of net outflows and turn to net inflows; whether the price can hold the $2,300–$2,350 area as sentiment fades; and whether delays to the Glamsterdam testnet will continue to weigh on the upgrade narrative.
#ETH #ETH Price Analysis
Price action:
Closed at $2,243.5 on October 30, down 0.36%. The market continued to digest fears following a security incident at a major exchange, compounded by net outflows of about $156 million from spot ETFs.
Closed at $2,254.8 on October 31, up 0.50%.
Closed at $2,274.6 on November 1, up 0.87%.
Closed at $2,252.5 on November 2, down 0.98%. Spot ETFs saw net outflows of about $140 million, with BlackRock's ETHA accounting for nearly all redemptions that day.
Closed at $2,274.5 on November 3, up 0.97%.
Opened at $2,274.5 today; latest price: $2,429.4, up 6.81%.
Main drivers:
1. Conclusion of the midterm elections and unwinding of hedges. After the election results were finalized, the U.S. Dollar Index fell and the 10-year Treasury yield declined. Pre-election hedges were unwound en masse, lifting risk assets broadly. Ethereum rallied from around $2,274.5 to around $2,429.4, significantly outperforming Bitcoin's roughly 4% rebound over the same period and briefly moving above $2,400.
2. Continued spot ETF redemptions. Net outflows totaled about $1.61 billion in October. Outflows on October 30, November 2 and November 3 were about $156 million, $140 million and $85.3 million, respectively. BlackRock's ETHA accounted for most of the selling pressure, and the fund's net assets fell from about $17.7 billion in early October to around $13.3 billion.
3. Aftermath of the exchange security incident. The October 29 incident led to the theft of about 200,000 Ethereum-related assets and the liquidation of roughly $1.5 billion in positions across the market. The price briefly fell to around $2,170. Since then, companies such as BitMine have made modest additions to their treasury holdings, but these have been insufficient to offset ETF selling pressure.
4. Short liquidations amplified the rebound. In the roughly two hours after U.S. equities opened on November 4, about $236 million in Ethereum-related contracts were liquidated, including roughly $132 million in short positions. The price surged from an intraday low of around $2,226 to near $2,450, triggering a short squeeze.
Summary: From October 30 to November 3, Ethereum fluctuated around $2,250 amid the lingering effects of the security incident and continued ETF redemptions, with daily moves of less than 1% in either direction. Today, after the election results became clear, a weaker dollar and improved risk appetite, combined with short liquidations, drove the price rapidly up from its opening level of $2,274.5 to around $2,429.4. It gained 6.81% intraday, outperforming Bitcoin for the period. Modest corporate treasury buying has provided some support, but fund redemptions have yet to reverse, so a sustained rebound will still require supportive fund flows. For short-term trading, the local engine's structure is bullish, favoring limit orders and waiting for a deep pullback: entry reference around $2,265, stop-loss at $2,263, target at $2,448, reference leverage of 5x, and 70% confidence.
What to watch next: Whether spot Ethereum ETFs can end seven consecutive days of net outflows and turn to net inflows; whether the price can hold the $2,300–$2,350 area as sentiment fades; and whether delays to the Glamsterdam testnet will continue to weigh on the upgrade narrative.
#ETH #ETH Price Analysis
·
--
$BTC Bitcoin fell to around $76,000 at the end of October amid tight exchange rates, an exchange security incident, and ETF redemptions, then dropped another 1.94% on November 2. After the election results became clear today, it rebounded rapidly from its low; the latest price is around $80,568, up about 4.05% from today's open.
Price movements:
October 30: Closed at 77,338, down 0.78%; the Binance security incident and liquidations exceeding $1 billion intensified selling.
October 31: Closed at 77,535, up 0.25%.
November 1: Closed at 78,326, up 1.02%.
November 2: Closed at 76,805, down 1.94%; spot ETFs saw net outflows of about $399 million for the day.
November 3: Closed at 77,435, up 0.82%.
Today: Opened at 77,434; latest price is 80,568, up 4.05%.
Main reasons:
1. Hawkish interest rates and an exchange security shock. On October 28, the Federal Reserve held rates at 3.75%–4%, with some committee members favoring a rate hike. From October 29 to 30, Binance disclosed a security incident involving around $6 billion and suspended withdrawals. Large-scale liquidations of long positions pushed the price down to around $76,000.
2. Continued net redemptions from spot ETFs. Net outflows were about $643 million on October 30, $399 million on November 2, and $116 million on November 3. Total net redemptions over five trading days were around $1 billion, as institutional buying continued to weaken.
3. Weak U.S. spot demand. The Coinbase premium remained negative for an extended period. Together with pullbacks in tech stocks and risk assets, spot buying was insufficient to absorb selling pressure.
4. Short covering after the election results. Once the midterm election results became clear on November 4, uncertainty eased. The price rebounded from a low of around $75,700, with about $380 million in short positions squeezed; intraday, it rose from the opening price of 77,434 to around 80,568.
Summary: This move fell first, then rebounded. Tight macro conditions at month-end, the Binance incident, and ETF redemptions pushed the price down to around $76,000, with the largest drop on November 2. Today, easing election uncertainty combined with short covering lifted the price about 4% from its intraday low, although institutional fund flows remain weak. For short-term trading, the local engine's structure is also bullish, favoring limit orders and waiting for a deep pullback: entry reference around 77,746, stop-loss at 77,668, target at 81,096, reference leverage of 5x, confidence 70.
What to watch next: Whether U.S. spot Bitcoin ETFs can end their streak of net outflows and return to net inflows; whether the price can hold above $80,000 and absorb post-election volatility; and how the path of the December rate decision affects risk appetite.
#BTC #BTC Price Analysis
$BTC Bitcoin fell to around $76,000 at the end of October amid tight exchange rates, an exchange security incident, and ETF redemptions, then dropped another 1.94% on November 2. After the election results became clear today, it rebounded rapidly from its low; the latest price is around $80,568, up about 4.05% from today's open.
Price movements:
October 30: Closed at 77,338, down 0.78%; the Binance security incident and liquidations exceeding $1 billion intensified selling.
October 31: Closed at 77,535, up 0.25%.
November 1: Closed at 78,326, up 1.02%.
November 2: Closed at 76,805, down 1.94%; spot ETFs saw net outflows of about $399 million for the day.
November 3: Closed at 77,435, up 0.82%.
Today: Opened at 77,434; latest price is 80,568, up 4.05%.
Main reasons:
1. Hawkish interest rates and an exchange security shock. On October 28, the Federal Reserve held rates at 3.75%–4%, with some committee members favoring a rate hike. From October 29 to 30, Binance disclosed a security incident involving around $6 billion and suspended withdrawals. Large-scale liquidations of long positions pushed the price down to around $76,000.
2. Continued net redemptions from spot ETFs. Net outflows were about $643 million on October 30, $399 million on November 2, and $116 million on November 3. Total net redemptions over five trading days were around $1 billion, as institutional buying continued to weaken.
3. Weak U.S. spot demand. The Coinbase premium remained negative for an extended period. Together with pullbacks in tech stocks and risk assets, spot buying was insufficient to absorb selling pressure.
4. Short covering after the election results. Once the midterm election results became clear on November 4, uncertainty eased. The price rebounded from a low of around $75,700, with about $380 million in short positions squeezed; intraday, it rose from the opening price of 77,434 to around 80,568.
Summary: This move fell first, then rebounded. Tight macro conditions at month-end, the Binance incident, and ETF redemptions pushed the price down to around $76,000, with the largest drop on November 2. Today, easing election uncertainty combined with short covering lifted the price about 4% from its intraday low, although institutional fund flows remain weak. For short-term trading, the local engine's structure is also bullish, favoring limit orders and waiting for a deep pullback: entry reference around 77,746, stop-loss at 77,668, target at 81,096, reference leverage of 5x, confidence 70.
What to watch next: Whether U.S. spot Bitcoin ETFs can end their streak of net outflows and return to net inflows; whether the price can hold above $80,000 and absorb post-election volatility; and how the path of the December rate decision affects risk appetite.
#BTC #BTC Price Analysis
Price movements:
October 30: Closed at 77,338, down 0.78%; the Binance security incident and liquidations exceeding $1 billion intensified selling.
October 31: Closed at 77,535, up 0.25%.
November 1: Closed at 78,326, up 1.02%.
November 2: Closed at 76,805, down 1.94%; spot ETFs saw net outflows of about $399 million for the day.
November 3: Closed at 77,435, up 0.82%.
Today: Opened at 77,434; latest price is 80,568, up 4.05%.
Main reasons:
1. Hawkish interest rates and an exchange security shock. On October 28, the Federal Reserve held rates at 3.75%–4%, with some committee members favoring a rate hike. From October 29 to 30, Binance disclosed a security incident involving around $6 billion and suspended withdrawals. Large-scale liquidations of long positions pushed the price down to around $76,000.
2. Continued net redemptions from spot ETFs. Net outflows were about $643 million on October 30, $399 million on November 2, and $116 million on November 3. Total net redemptions over five trading days were around $1 billion, as institutional buying continued to weaken.
3. Weak U.S. spot demand. The Coinbase premium remained negative for an extended period. Together with pullbacks in tech stocks and risk assets, spot buying was insufficient to absorb selling pressure.
4. Short covering after the election results. Once the midterm election results became clear on November 4, uncertainty eased. The price rebounded from a low of around $75,700, with about $380 million in short positions squeezed; intraday, it rose from the opening price of 77,434 to around 80,568.
Summary: This move fell first, then rebounded. Tight macro conditions at month-end, the Binance incident, and ETF redemptions pushed the price down to around $76,000, with the largest drop on November 2. Today, easing election uncertainty combined with short covering lifted the price about 4% from its intraday low, although institutional fund flows remain weak. For short-term trading, the local engine's structure is also bullish, favoring limit orders and waiting for a deep pullback: entry reference around 77,746, stop-loss at 77,668, target at 81,096, reference leverage of 5x, confidence 70.
What to watch next: Whether U.S. spot Bitcoin ETFs can end their streak of net outflows and return to net inflows; whether the price can hold above $80,000 and absorb post-election volatility; and how the path of the December rate decision affects risk appetite.
#BTC #BTC Price Analysis
7
·
--
$ETH The structure is leaning bullish. The price has rebounded nearly 6% from the low of 2226 and is currently at 2433, above the Bollinger upper band at 2411, with percent_b at 1.11. Fund flows are decisive: net active buying over the past 24 hours is about 340,000 coins. Buyers have dominated in recent periods, although selling pressure has picked up somewhat over the past 6 hours. Key levels first: resistance above at 2450, the shared high for the 20-hour and 96-hour periods, where trapped positions are concentrated; support below at 2241–2265, from the lower edge of the value area to the POC cost zone—the bulls’ stronghold in this move. Don’t chase the price with the order: place a limit buy directly at 2265, near the POC and the upper edge of the support wall, and wait for a pullback fill. Stop-loss at 2263, about 0.1% below entry—a very tight placement. The logic is simple: if the price falls back here, it means the pullback has turned into a breakdown and the bullish structure has failed, so exit immediately. Target 2448, within the deep trapped-position zone just below the 96-hour high of 2450. Once the price reaches this level, it could trigger a chain of stop-loss orders and sweep through this liquidity in the prevailing direction, with a measured risk-reward ratio of about 80. In short, the risks: if the pullback is shallow and the price breaks upward directly, the order won’t fill; if the pullback is too deep and breaks through support, the stop-loss will be hit. Follow the plan in either case—don’t bet on direction. #ETH #ETH Price Analysis
$ETH The structure is leaning bullish. The price has rebounded nearly 6% from the low of 2226 and is currently at 2433, above the Bollinger upper band at 2411, with percent_b at 1.11. Fund flows are decisive: net active buying over the past 24 hours is about 340,000 coins. Buyers have dominated in recent periods, although selling pressure has picked up somewhat over the past 6 hours. Key levels first: resistance above at 2450, the shared high for the 20-hour and 96-hour periods, where trapped positions are concentrated; support below at 2241–2265, from the lower edge of the value area to the POC cost zone—the bulls’ stronghold in this move. Don’t chase the price with the order: place a limit buy directly at 2265, near the POC and the upper edge of the support wall, and wait for a pullback fill. Stop-loss at 2263, about 0.1% below entry—a very tight placement. The logic is simple: if the price falls back here, it means the pullback has turned into a breakdown and the bullish structure has failed, so exit immediately. Target 2448, within the deep trapped-position zone just below the 96-hour high of 2450. Once the price reaches this level, it could trigger a chain of stop-loss orders and sweep through this liquidity in the prevailing direction, with a measured risk-reward ratio of about 80. In short, the risks: if the pullback is shallow and the price breaks upward directly, the order won’t fill; if the pullback is too deep and breaks through support, the stop-loss will be hit. Follow the plan in either case—don’t bet on direction. #ETH #ETH Price Analysis
33
·
--
$BTC The structure is leaning bullish, with the price currently at 80431, already above the upper Bollinger Band at 80183. percent_b has risen to 1.06, and the bands are in an upward-trending range, with bulls in control of intraday pricing. On the funding side, net aggressive buying over the past 24 hours is approximately 28,000 coins. The daily gain is about 3.5%, and buyers have maintained the upper hand over the past several sessions, with sentiment and market structure moving in the same direction. Key levels: 77746 below is the POC cost zone in the volume profile. Together with the Bollinger midline at 78087 and the upper edge of the value area at 78524, it forms the main support zone on a pullback. Above, the 96-hour high at 81177 and the selling pressure zone near 81096 are the first resistance wall this rebound will have to face. The current price is too close to overhead resistance, while the main support zone is about 3% below. Rather than chasing a long at the current price, place a limit buy order at the 77746 POC level and wait for a pullback to the cost zone. The closer the entry is to the high-volume trading area, the greater the position's margin of safety. Set the stop loss at 77668, about 0.1% below the entry. If the price decisively falls below this level, that means the pullback has turned into a genuine breakdown and the bullish structure has failed; exit unconditionally. The target is the selling pressure zone around 81096, near the 96-hour high. This is the first meaningful structural resistance above and the first take-profit window for the long position, with a measured risk/reward ratio of about 43 based on the limit order price. The main risks are that the price breaks higher without pulling back, leaving the order unfilled, or that the pullback runs too deep and hits the stop loss. Both scenarios require strict adherence to the predefined plan. #BTC #BTC Price Analysis
$BTC The structure is leaning bullish, with the price currently at 80431, already above the upper Bollinger Band at 80183. percent_b has risen to 1.06, and the bands are in an upward-trending range, with bulls in control of intraday pricing. On the funding side, net aggressive buying over the past 24 hours is approximately 28,000 coins. The daily gain is about 3.5%, and buyers have maintained the upper hand over the past several sessions, with sentiment and market structure moving in the same direction. Key levels: 77746 below is the POC cost zone in the volume profile. Together with the Bollinger midline at 78087 and the upper edge of the value area at 78524, it forms the main support zone on a pullback. Above, the 96-hour high at 81177 and the selling pressure zone near 81096 are the first resistance wall this rebound will have to face. The current price is too close to overhead resistance, while the main support zone is about 3% below. Rather than chasing a long at the current price, place a limit buy order at the 77746 POC level and wait for a pullback to the cost zone. The closer the entry is to the high-volume trading area, the greater the position's margin of safety. Set the stop loss at 77668, about 0.1% below the entry. If the price decisively falls below this level, that means the pullback has turned into a genuine breakdown and the bullish structure has failed; exit unconditionally. The target is the selling pressure zone around 81096, near the 96-hour high. This is the first meaningful structural resistance above and the first take-profit window for the long position, with a measured risk/reward ratio of about 43 based on the limit order price. The main risks are that the price breaks higher without pulling back, leaving the order unfilled, or that the pullback runs too deep and hits the stop loss. Both scenarios require strict adherence to the predefined plan. #BTC #BTC Price Analysis
27
·
--
See translation
抽我!
抽我!

羽昕Wing
·
--
Ahhh! We’ve reached 3,000 followers ✨
Thank you all so much!
I’ve decided to give away a little something to celebrate~
🎁 Prize: 50U
👥 10 lucky winners
It’s super easy to enter:
✅ Follow me
✅ Like this post
✅ Comment: May good luck come your way~
Sharing this post will give you an extra chance to win!
Deadline: November 8
I’ll tag the winners in the comments after the draw
Let’s go! Hope good luck comes your way 🍀
Thank you all so much!
I’ve decided to give away a little something to celebrate~
🎁 Prize: 50U
👥 10 lucky winners
It’s super easy to enter:
✅ Follow me
✅ Like this post
✅ Comment: May good luck come your way~
Sharing this post will give you an extra chance to win!
Deadline: November 8
I’ll tag the winners in the comments after the draw
Let’s go! Hope good luck comes your way 🍀

·
--
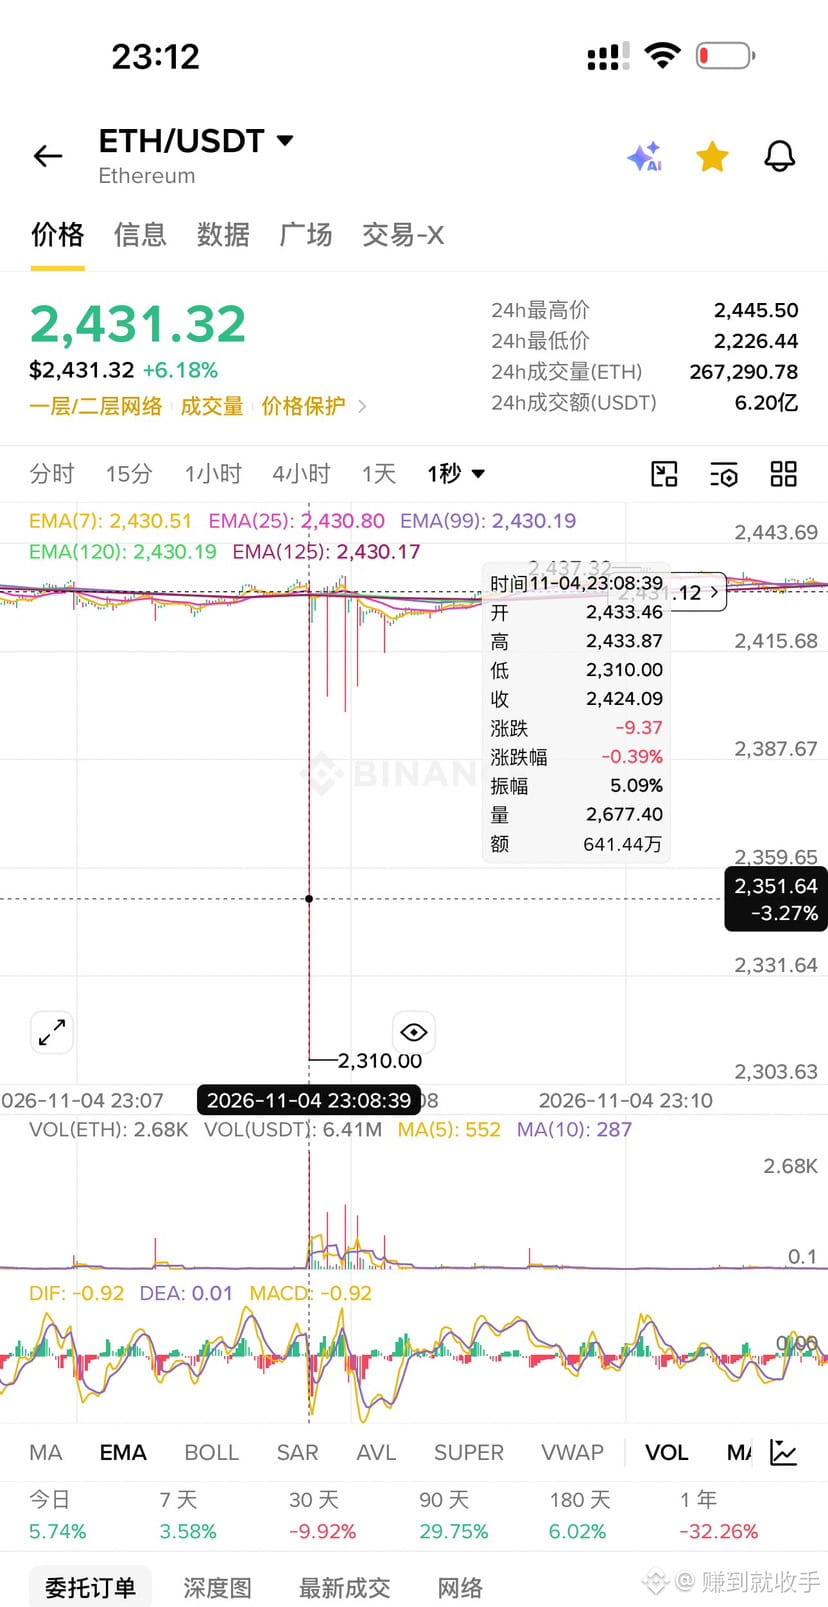
So which big shot got liquidated this time?$ETH #eth
So which big shot got liquidated this time?$ETH #eth
356
·
--
$ETH The structure has turned bullish, with price recovering steadily from the low of 2226 to 2329 and only a limited pullback. Key levels: resistance at the 96-hour high of 2339, followed by the upper Bollinger Band at 2342; support at the POC of 2293, with the value area low at 2254. Order setup: place a limit buy at 2293, entering near the POC and support wall—don't chase the price higher. Stop-loss at 2291, just below the POC. A decisive break below it would invalidate the bullish structure, so don't take chances. Target: 2337, near the selling pressure zone at the 96-hour high of 2339. From an entry at 2293 to the 2337 target, there's about $44 of upside, while the stop risks just over $2—a risk/reward ratio of about 19:1, leaving ample room based on the measured move. One risk to note: there's considerable overhead supply around 2339. If price spikes and then drops quickly, the long position could be stopped out. #ETH #ETH Technical Analysis
$ETH The structure has turned bullish, with price recovering steadily from the low of 2226 to 2329 and only a limited pullback. Key levels: resistance at the 96-hour high of 2339, followed by the upper Bollinger Band at 2342; support at the POC of 2293, with the value area low at 2254. Order setup: place a limit buy at 2293, entering near the POC and support wall—don't chase the price higher. Stop-loss at 2291, just below the POC. A decisive break below it would invalidate the bullish structure, so don't take chances. Target: 2337, near the selling pressure zone at the 96-hour high of 2339. From an entry at 2293 to the 2337 target, there's about $44 of upside, while the stop risks just over $2—a risk/reward ratio of about 19:1, leaving ample room based on the measured move. One risk to note: there's considerable overhead supply around 2339. If price spikes and then drops quickly, the long position could be stopped out. #ETH #ETH Technical Analysis
1
122
·
--
$BTC has a bullish structure, with the price fluctuating around 78479, just above the POC at 77878. The pullback has been limited, while the Bollinger middle band at 77711 is rising and providing support, and the short-term structure is upward. On the flow side, net active buying over the past 24 hours is approximately 9,900 coins, with funds continuing to flow back in over both the 1-hour and daily time frames. The area around 77878 provides the main support. Key levels: support lies at the POC of 77878 and the upper edge of the value area at 78168; resistance lies at the 96-hour high of 78854 and the upper Bollinger band at 78996. The entry rationale is that the current price of 78479 is close to the support cluster and the upward structure remains intact, so enter a long at market without waiting for a pullback. Set the stop-loss at 77800, beyond the structural invalidation level; a decisive break below this area would mean the bullish structure has failed. The target is 78775, in the selling-pressure zone around the 96-hour high, which is the first significant area to take profit above. The main risk is heavy overhead supply near 78854; if the price quickly reverses after rising, the long position could be stopped out. #BTC #BTC Trend Analysis
$BTC has a bullish structure, with the price fluctuating around 78479, just above the POC at 77878. The pullback has been limited, while the Bollinger middle band at 77711 is rising and providing support, and the short-term structure is upward. On the flow side, net active buying over the past 24 hours is approximately 9,900 coins, with funds continuing to flow back in over both the 1-hour and daily time frames. The area around 77878 provides the main support. Key levels: support lies at the POC of 77878 and the upper edge of the value area at 78168; resistance lies at the 96-hour high of 78854 and the upper Bollinger band at 78996. The entry rationale is that the current price of 78479 is close to the support cluster and the upward structure remains intact, so enter a long at market without waiting for a pullback. Set the stop-loss at 77800, beyond the structural invalidation level; a decisive break below this area would mean the bullish structure has failed. The target is 78775, in the selling-pressure zone around the 96-hour high, which is the first significant area to take profit above. The main risk is heavy overhead supply near 78854; if the price quickly reverses after rising, the long position could be stopped out. #BTC #BTC Trend Analysis
15
·
--
$ETH The structure leans bullish. Over the past 24 hours, net aggressive buying was about 149,000 coins, and the price rebounded around 3.5% from a low of 2226, showing intraday strength. Resistance is at 2312–2315, where the 20-hour and 96-hour highs overlap; the Bollinger upper band at 2318 is just above. Support is at the POC of 2266, with the lower edge of the value area at 2243. The current price is 2304, close to overhead resistance and far from support, so it’s a poor spot to chase longs. Don’t chase. Place a 5x limit long at 2266.7 and wait for the price to pull back to the POC for execution. Stop at 2264.5, just below the limit order. If the pullback turns into a genuine breakdown and the price falls back below 2264, the bullish thesis is invalidated—exit immediately. Target 2312.9, where the 20-hour high overlaps with deeply trapped positions. The measured rationale is solid, with a risk-reward ratio of about 20.4; the trade-off is a very tight stop that could easily be triggered. One risk to note: if 2312 remains unbroken, the market may keep ranging, and the limit order may never get filled. #ETH #ETH price analysis
$ETH The structure leans bullish. Over the past 24 hours, net aggressive buying was about 149,000 coins, and the price rebounded around 3.5% from a low of 2226, showing intraday strength. Resistance is at 2312–2315, where the 20-hour and 96-hour highs overlap; the Bollinger upper band at 2318 is just above. Support is at the POC of 2266, with the lower edge of the value area at 2243. The current price is 2304, close to overhead resistance and far from support, so it’s a poor spot to chase longs. Don’t chase. Place a 5x limit long at 2266.7 and wait for the price to pull back to the POC for execution. Stop at 2264.5, just below the limit order. If the pullback turns into a genuine breakdown and the price falls back below 2264, the bullish thesis is invalidated—exit immediately. Target 2312.9, where the 20-hour high overlaps with deeply trapped positions. The measured rationale is solid, with a risk-reward ratio of about 20.4; the trade-off is a very tight stop that could easily be triggered. One risk to note: if 2312 remains unbroken, the market may keep ranging, and the limit order may never get filled. #ETH #ETH price analysis
303
·
--
$BTC The structure has turned bullish, with the price steadily recovering from the low near 75687 to around 78150. The Bollinger Bands are trending upward overall, and the current price is trading in the strong zone between the middle band at 77506 and the upper band at 78496. Pullbacks have remained limited, and buyers have clearly dominated over the past few sessions. On the flow side, net active buying over the past 24 hours was approximately 11,200 coins, so the buying base remains intact. However, selling pressure has picked up somewhat over the past six hours, so stay alert. Key levels: the POC and support wall cluster around 77666 below, roughly coinciding with the Bollinger middle band at 77506, forming the first layer of support on a pullback. Above, the 96-hour high near 78854 carries significant overhead supply; longs should take profit if the price rebounds to that level. The entry rationale is that the current price of 78150 is right near the upper edge of the value area and the support cluster, so go long at market with 5x leverage—no need to wait for a pullback. Set the stop loss at 77589, beyond the POC and support wall. If the price decisively breaks below this zone, it would signal that the current bullish structure has failed, so exit without hesitation. The target is 78775, the first meaningful resistance between the upper edge of the value area and the 96-hour high. The risk-reward ratio is about 1.1, making this a trend-following support-entry trade rather than a bet on a rebound. The main risk is that if holders caught at higher prices sell heavily after a spike, a quick price retreat could trigger the stop. Be prepared to sit through the volatility in this trade.#BTC #BTC Trend Analysis
$BTC The structure has turned bullish, with the price steadily recovering from the low near 75687 to around 78150. The Bollinger Bands are trending upward overall, and the current price is trading in the strong zone between the middle band at 77506 and the upper band at 78496. Pullbacks have remained limited, and buyers have clearly dominated over the past few sessions. On the flow side, net active buying over the past 24 hours was approximately 11,200 coins, so the buying base remains intact. However, selling pressure has picked up somewhat over the past six hours, so stay alert. Key levels: the POC and support wall cluster around 77666 below, roughly coinciding with the Bollinger middle band at 77506, forming the first layer of support on a pullback. Above, the 96-hour high near 78854 carries significant overhead supply; longs should take profit if the price rebounds to that level. The entry rationale is that the current price of 78150 is right near the upper edge of the value area and the support cluster, so go long at market with 5x leverage—no need to wait for a pullback. Set the stop loss at 77589, beyond the POC and support wall. If the price decisively breaks below this zone, it would signal that the current bullish structure has failed, so exit without hesitation. The target is 78775, the first meaningful resistance between the upper edge of the value area and the 96-hour high. The risk-reward ratio is about 1.1, making this a trend-following support-entry trade rather than a bet on a rebound. The main risk is that if holders caught at higher prices sell heavily after a spike, a quick price retreat could trigger the stop. Be prepared to sit through the volatility in this trade.#BTC #BTC Trend Analysis
43
·
--
$ETH The structure is neutral-to-bullish, with the current price at 2247. The upward structure remains intact, and pullbacks near 2244 are likely to find support. Key levels: resistance at 2267, the high-volume POC zone; above that, 2288 is the upper edge of the value area. Support is at 2244, where the lower Bollinger Band sits; below that, 2226 is the 20-hour low. Net aggressive buying over the past 24 hours is approximately 8,500 coins, with buyers accumulating at lower levels. Enter long directly at market: the pullback may not reach an ideal limit-entry price, so entering at the current price is more practical. Stop-loss at 2242, below the lower Bollinger Band. A break below this level would turn the pullback into a breakdown, so exit and accept the loss. Target: 2267, near the high-volume POC zone, for an estimated risk-reward ratio of about 3.6. Risk: a deeper-than-expected pullback could immediately breach 2247, requiring the structure to be reassessed. #ETH #ETH Price Analysis
$ETH The structure is neutral-to-bullish, with the current price at 2247. The upward structure remains intact, and pullbacks near 2244 are likely to find support. Key levels: resistance at 2267, the high-volume POC zone; above that, 2288 is the upper edge of the value area. Support is at 2244, where the lower Bollinger Band sits; below that, 2226 is the 20-hour low. Net aggressive buying over the past 24 hours is approximately 8,500 coins, with buyers accumulating at lower levels. Enter long directly at market: the pullback may not reach an ideal limit-entry price, so entering at the current price is more practical. Stop-loss at 2242, below the lower Bollinger Band. A break below this level would turn the pullback into a breakdown, so exit and accept the loss. Target: 2267, near the high-volume POC zone, for an estimated risk-reward ratio of about 3.6. Risk: a deeper-than-expected pullback could immediately breach 2247, requiring the structure to be reassessed. #ETH #ETH Price Analysis
103
·
--
$BTC The structure is neutral to bearish. Price is hovering around 76416 along the lower Bollinger Band, and the middle band has already turned down. The short-term rebound is capped below the lower edge of the value area, making this look more like weak consolidation after a decline than the start of a trend reversal. Over the past 24 hours, net aggressive selling has totaled approximately 1,700 coins, so selling pressure has yet to clear and sentiment remains cautious. The overhead cost zone is concentrated around the POC at 77666. The upper edge of the value area at 78062 coincides with the 20-hour high at 78046, forming a clear resistance zone; a rebound into that area would be a selling opportunity. There is still room between the current price and overhead resistance, while the downside target is farther away, so do not chase a short at the current price. Instead, place a sell order at 77666 and wait for price to pull back into that area. Set the stop-loss above 77744. If price holds above that zone, it would mean the pullback has turned into a genuine breakout and the bearish structure is invalidated. The target is 75763, near the recent low of 75687, which is the first meaningful structural support below. The measured move is approximately 24.5 times the stop-loss distance. The main risk is that the higher-timeframe trend remains bullish, conflicting with the short-term bearish structure. If larger-timeframe buyers continue to enter, they could trigger the stop on this resting order. #BTC #BTC Price Analysis
$BTC The structure is neutral to bearish. Price is hovering around 76416 along the lower Bollinger Band, and the middle band has already turned down. The short-term rebound is capped below the lower edge of the value area, making this look more like weak consolidation after a decline than the start of a trend reversal. Over the past 24 hours, net aggressive selling has totaled approximately 1,700 coins, so selling pressure has yet to clear and sentiment remains cautious. The overhead cost zone is concentrated around the POC at 77666. The upper edge of the value area at 78062 coincides with the 20-hour high at 78046, forming a clear resistance zone; a rebound into that area would be a selling opportunity. There is still room between the current price and overhead resistance, while the downside target is farther away, so do not chase a short at the current price. Instead, place a sell order at 77666 and wait for price to pull back into that area. Set the stop-loss above 77744. If price holds above that zone, it would mean the pullback has turned into a genuine breakout and the bearish structure is invalidated. The target is 75763, near the recent low of 75687, which is the first meaningful structural support below. The measured move is approximately 24.5 times the stop-loss distance. The main risk is that the higher-timeframe trend remains bullish, conflicting with the short-term bearish structure. If larger-timeframe buyers continue to enter, they could trigger the stop on this resting order. #BTC #BTC Price Analysis
49
·
--
$ETH The structure is leaning bullish, with the current price at 2278. The 1-hour Bollinger Bands are rising, and the middle band at 2278.55 is right beneath the price. Key levels: resistance above at 2309–2315. The 20-hour high at 2309.4, the upper Bollinger Band at 2311.3, and the 96-hour high at 2315.2 converge, forming the ceiling for this rebound. Support is at 2253, with the POC and the lower edge of the value area at 2243 providing support nearby; below that is the interim low at 2240. Enter long at market at the current order price of 2277.8. Getting in early is preferable to waiting, with about 1.4% upside to 2309. Set the stop-loss at 2250.79, below the POC. A move back below 2251 would turn the retest into a genuine breakdown, invalidate the bullish thesis, and call for exiting. Target 2313, near the upper Bollinger Band and the 20-hour high, for a risk/reward ratio of about 1.3. One risk to note: if 2309 cannot be decisively broken, price may continue ranging within the 2243–2288 value area, increasing the time cost of holding the long position. #ETH #ETH trend analysis
$ETH The structure is leaning bullish, with the current price at 2278. The 1-hour Bollinger Bands are rising, and the middle band at 2278.55 is right beneath the price. Key levels: resistance above at 2309–2315. The 20-hour high at 2309.4, the upper Bollinger Band at 2311.3, and the 96-hour high at 2315.2 converge, forming the ceiling for this rebound. Support is at 2253, with the POC and the lower edge of the value area at 2243 providing support nearby; below that is the interim low at 2240. Enter long at market at the current order price of 2277.8. Getting in early is preferable to waiting, with about 1.4% upside to 2309. Set the stop-loss at 2250.79, below the POC. A move back below 2251 would turn the retest into a genuine breakdown, invalidate the bullish thesis, and call for exiting. Target 2313, near the upper Bollinger Band and the 20-hour high, for a risk/reward ratio of about 1.3. One risk to note: if 2309 cannot be decisively broken, price may continue ranging within the 2243–2288 value area, increasing the time cost of holding the long position. #ETH #ETH trend analysis
162
·
--
$BTC The structure is neutral to bullish. After rebounding about 1.5% from the low of 76342, the price is consolidating in a narrow range around 77495. It has moved back above the Bollinger middle band at 77334 intraday, while the bands continue to slope upward. On the flow side, net aggressive buying over the past 24 hours was about 970 BTC. The cost-basis center of gravity and aggressive buying are both pointing higher, while the value area from 76970 to 78142, together with the POC at 77619, forms the current zone of concentrated positions. The first resistance above is the upper Bollinger band at 78164. Beyond that, there is heavy overhead supply around the 96-hour high near 78854, the last major hurdle before taking profit. Below, the lower Bollinger band at 76504 sits close to the swing low at 76342, forming a support base for the bulls. For entry, buy at the current market price of 77495 without waiting for a deeper pullback. The structure has not yet provided enough room for a retest, so an early entry offers a more favorable position within the value area. Set the stop-loss at 76427, below the lower Bollinger band. A break below this level would indicate that the pullback has turned into a breakdown and the bullish structure has failed; exit and accept the loss. The target is 78775. Take profit on the long position if the price rebounds to this level, for a risk-reward ratio of about 1.2. Only if the price then holds above 78854 with increased volume can the structure be considered to have improved. The main risk is the heavy overhead supply; a sharp pullback after a spike could trigger the stop-loss. Keep leverage at no more than 5x.#BTC #BTC Price Analysis
$BTC The structure is neutral to bullish. After rebounding about 1.5% from the low of 76342, the price is consolidating in a narrow range around 77495. It has moved back above the Bollinger middle band at 77334 intraday, while the bands continue to slope upward. On the flow side, net aggressive buying over the past 24 hours was about 970 BTC. The cost-basis center of gravity and aggressive buying are both pointing higher, while the value area from 76970 to 78142, together with the POC at 77619, forms the current zone of concentrated positions. The first resistance above is the upper Bollinger band at 78164. Beyond that, there is heavy overhead supply around the 96-hour high near 78854, the last major hurdle before taking profit. Below, the lower Bollinger band at 76504 sits close to the swing low at 76342, forming a support base for the bulls. For entry, buy at the current market price of 77495 without waiting for a deeper pullback. The structure has not yet provided enough room for a retest, so an early entry offers a more favorable position within the value area. Set the stop-loss at 76427, below the lower Bollinger band. A break below this level would indicate that the pullback has turned into a breakdown and the bullish structure has failed; exit and accept the loss. The target is 78775. Take profit on the long position if the price rebounds to this level, for a risk-reward ratio of about 1.2. Only if the price then holds above 78854 with increased volume can the structure be considered to have improved. The main risk is the heavy overhead supply; a sharp pullback after a spike could trigger the stop-loss. Keep leverage at no more than 5x.#BTC #BTC Price Analysis
75
·
--
$ETH The structure has turned bullish, with the price recovering from a low of 2232 to 2287. The pullback has been limited, and buyers have clearly had the upper hand over the past half-day. Key levels: resistance at the upper Bollinger Band at 2308 and the 96-hour high at 2315; support at the Bollinger midline at 2272, the POC at 2253, and the value area low at 2240, which is also the 20-hour low. Trade plan: at the current price of 2287, the price is near a key structural level, so go long at market without waiting for a pullback. Set the stop at 2251, beyond the POC and support zone. A decisive break below this area would invalidate the bullish structure, so exit without hesitation. Target 2313: the rationale is that this would slightly clear the upper Bollinger Band at 2308 and approach the 96-hour high at 2315. Take profit on the long when the rebound reaches that level, for a risk-reward ratio of approximately 0.7. Over the past 24 hours, net aggressive buying was about 57,000 coins, supporting sentiment. One risk to note: the higher-timeframe trend remains bearish, conflicting with the hourly bullish structure. If support breaks, accept the loss and exit rather than holding on. #ETH #ETH Price Analysis
$ETH The structure has turned bullish, with the price recovering from a low of 2232 to 2287. The pullback has been limited, and buyers have clearly had the upper hand over the past half-day. Key levels: resistance at the upper Bollinger Band at 2308 and the 96-hour high at 2315; support at the Bollinger midline at 2272, the POC at 2253, and the value area low at 2240, which is also the 20-hour low. Trade plan: at the current price of 2287, the price is near a key structural level, so go long at market without waiting for a pullback. Set the stop at 2251, beyond the POC and support zone. A decisive break below this area would invalidate the bullish structure, so exit without hesitation. Target 2313: the rationale is that this would slightly clear the upper Bollinger Band at 2308 and approach the 96-hour high at 2315. Take profit on the long when the rebound reaches that level, for a risk-reward ratio of approximately 0.7. Over the past 24 hours, net aggressive buying was about 57,000 coins, supporting sentiment. One risk to note: the higher-timeframe trend remains bearish, conflicting with the hourly bullish structure. If support breaks, accept the loss and exit rather than holding on. #ETH #ETH Price Analysis
38
·
--
$BTC The structure is neutral to bullish, with the price trading close to the value area POC around 77619. The upward structure remains intact, and there is still room between the hourly Bollinger midline at 77172 and upper band at 77936. However, the higher-timeframe channel is still trending down, so this trade requires staying calm through volatility. On the flow side, net aggressive buying over the past 24 hours was about 3,200 coins. Buyers have had the upper hand in recent periods, but selling pressure has picked up again over the last 6 hours, so sentiment can only be described as cautiously recovering. Key levels: the POC at 77619 is almost exactly in line with the current price. Above, the Bollinger upper band at 77936 and the 20-hour high at 77872 form the first resistance zone, followed by the 96-hour high at 78854. Below, 76928 marks the lower edge of the value area, while 76342 is the 96-hour low. The entry logic is straightforward: the current price is near a key structural level, making this a suitable entry point. Go long at market now; there is no need to wait for a pullback. Set the stop-loss at 77541. If the price falls back below that level, it means the pullback has turned into a genuine breakdown, invalidating the bullish thesis—exit decisively. The target is the upper edge of the value area at 78142, the first meaningful take-profit level in this rebound, offering a risk-reward ratio of about 6.7. The main risk is that the higher-timeframe trend remains bearish, conflicting with the hourly bullish structure. Strictly honor the stop-loss if short-term volatility picks up. #BTC #BTC Price Analysis
$BTC The structure is neutral to bullish, with the price trading close to the value area POC around 77619. The upward structure remains intact, and there is still room between the hourly Bollinger midline at 77172 and upper band at 77936. However, the higher-timeframe channel is still trending down, so this trade requires staying calm through volatility. On the flow side, net aggressive buying over the past 24 hours was about 3,200 coins. Buyers have had the upper hand in recent periods, but selling pressure has picked up again over the last 6 hours, so sentiment can only be described as cautiously recovering. Key levels: the POC at 77619 is almost exactly in line with the current price. Above, the Bollinger upper band at 77936 and the 20-hour high at 77872 form the first resistance zone, followed by the 96-hour high at 78854. Below, 76928 marks the lower edge of the value area, while 76342 is the 96-hour low. The entry logic is straightforward: the current price is near a key structural level, making this a suitable entry point. Go long at market now; there is no need to wait for a pullback. Set the stop-loss at 77541. If the price falls back below that level, it means the pullback has turned into a genuine breakdown, invalidating the bullish thesis—exit decisively. The target is the upper edge of the value area at 78142, the first meaningful take-profit level in this rebound, offering a risk-reward ratio of about 6.7. The main risk is that the higher-timeframe trend remains bearish, conflicting with the hourly bullish structure. Strictly honor the stop-loss if short-term volatility picks up. #BTC #BTC Price Analysis
16
·
--
$ETH The structure has turned bullish, with buyers clearly dominant over the past few periods. The price has steadily recovered from a low of 2218 to around 2299, with only a limited pullback. Key levels: resistance is at the upper Bollinger Band at 2298 and the 96-hour high at 2315; support is at the POC at 2253 and the lower edge of the value area at 2237. Don’t chase the price: place a limit order for a long position at 2253, at the POC and the center of the recent trading range, about 2% below the current price, and wait for a retest. Stop-loss: 2250, below the POC and support zone. A break below this level would mean the pullback has turned into a breakdown, so cut the loss immediately. Target: 2313, near the 96-hour high of 2315, which is the measured target for this recovery move. The risk-reward ratio is approximately 26.7x. Net aggressive buying over the past 24 hours was about 21,600 coins, indicating continued support at lower levels. One risk to note: the higher-timeframe trend remains bearish, which conflicts with this long setup, so be prepared to withstand volatility. #ETH #ETH Price Analysis
$ETH The structure has turned bullish, with buyers clearly dominant over the past few periods. The price has steadily recovered from a low of 2218 to around 2299, with only a limited pullback. Key levels: resistance is at the upper Bollinger Band at 2298 and the 96-hour high at 2315; support is at the POC at 2253 and the lower edge of the value area at 2237. Don’t chase the price: place a limit order for a long position at 2253, at the POC and the center of the recent trading range, about 2% below the current price, and wait for a retest. Stop-loss: 2250, below the POC and support zone. A break below this level would mean the pullback has turned into a breakdown, so cut the loss immediately. Target: 2313, near the 96-hour high of 2315, which is the measured target for this recovery move. The risk-reward ratio is approximately 26.7x. Net aggressive buying over the past 24 hours was about 21,600 coins, indicating continued support at lower levels. One risk to note: the higher-timeframe trend remains bearish, which conflicts with this long setup, so be prepared to withstand volatility. #ETH #ETH Price Analysis
31
·
--
$BTC The structure is bearish. Price is trading near 77657, close to the Bollinger upper band at 77669. The bands remain in a downtrend, and rebound momentum is insufficient; selling pressure from trapped positions in this area has not been fully absorbed. In terms of order flow, net aggressive selling over the past 24 hours was about 1260 coins, with positions continuing to shift from bulls to bears, keeping sentiment cautious. Key levels: overhead resistance is the pressure zone formed by the Bollinger upper band at 77669 and the 20-hour high at 77864; a rebound into that zone would be a selling opportunity. The first meaningful downside target is the POC at 76933, with substantial liquidation fuel still accumulated deeper down near 76264. The entry logic is that the current price is pressing against a key structural level, very close to overhead resistance and with ample room to the downside target, making this a suitable entry point now. Short at market without waiting for a rebound. Place the stop loss at 77747, above the Bollinger upper band. If price holds above that level, it would mean the rebound has exceeded expectations and the bearish structure has failed; exit and cut the loss. Target the value area at 76933, where long positions are concentrated and likely to be liquidated. A break below that level would open up greater downside potential, with a risk/reward ratio of about 8:1. The main risk is the substantial liquidation fuel below; if price drops sharply and then rebounds quickly, the short position may be stopped out.#BTC #BTC Price Analysis
$BTC The structure is bearish. Price is trading near 77657, close to the Bollinger upper band at 77669. The bands remain in a downtrend, and rebound momentum is insufficient; selling pressure from trapped positions in this area has not been fully absorbed. In terms of order flow, net aggressive selling over the past 24 hours was about 1260 coins, with positions continuing to shift from bulls to bears, keeping sentiment cautious. Key levels: overhead resistance is the pressure zone formed by the Bollinger upper band at 77669 and the 20-hour high at 77864; a rebound into that zone would be a selling opportunity. The first meaningful downside target is the POC at 76933, with substantial liquidation fuel still accumulated deeper down near 76264. The entry logic is that the current price is pressing against a key structural level, very close to overhead resistance and with ample room to the downside target, making this a suitable entry point now. Short at market without waiting for a rebound. Place the stop loss at 77747, above the Bollinger upper band. If price holds above that level, it would mean the rebound has exceeded expectations and the bearish structure has failed; exit and cut the loss. Target the value area at 76933, where long positions are concentrated and likely to be liquidated. A break below that level would open up greater downside potential, with a risk/reward ratio of about 8:1. The main risk is the substantial liquidation fuel below; if price drops sharply and then rebounds quickly, the short position may be stopped out.#BTC #BTC Price Analysis
10
·
--
$ETH The structure is bearish, with price repeatedly weakening below the high-volume area at 2253. The 4-hour trend remains downward. Key levels: resistance at 2270, where the upper Bollinger Band overlaps with a dense break-even selling zone; support at 2253, the POC level. No need to wait around for an order: the current price of 2264 is near a key structural level, making this a suitable entry point. Sell short at market. Set the stop-loss at 2272, above the upper Bollinger Band. If price holds above this level, the rebound has exceeded expectations, so exit and accept the loss. Target the high-volume area at 2253, where the POC is located. The distance is sufficient to cover the stop-loss, giving a risk-reward ratio of about 1.3. One risk to note: if price fails to break below 2253 for an extended period, it may keep fluctuating within the range, and the short position will incur time costs. #ETH #ETH Price Analysis
$ETH The structure is bearish, with price repeatedly weakening below the high-volume area at 2253. The 4-hour trend remains downward. Key levels: resistance at 2270, where the upper Bollinger Band overlaps with a dense break-even selling zone; support at 2253, the POC level. No need to wait around for an order: the current price of 2264 is near a key structural level, making this a suitable entry point. Sell short at market. Set the stop-loss at 2272, above the upper Bollinger Band. If price holds above this level, the rebound has exceeded expectations, so exit and accept the loss. Target the high-volume area at 2253, where the POC is located. The distance is sufficient to cover the stop-loss, giving a risk-reward ratio of about 1.3. One risk to note: if price fails to break below 2253 for an extended period, it may keep fluctuating within the range, and the short position will incur time costs. #ETH #ETH Price Analysis
47
·
--
$BTC The structure is bearish. The price has continued to retreat from a high near 78854 to around 77000, and the rebound has been weak. Sellers have clearly dominated over the past several periods, while funds have continued to flow out on both the 1-hour and daily charts. Net aggressive selling over the past 24 hours has been approximately 5,900 coins. The upper Bollinger Band around 77264 is the main resistance; a rebound to that level would encounter pressure. The current rebound is too weak to reach the ideal limit-order entry, so entering a short at market now is more practical, with 77000 as a reference entry price. Place the stop-loss above the upper Bollinger Band at 77341. If the price holds above that level, the rebound has exceeded expectations and the bearish structure is invalidated; exit and accept the loss. The target is 76340, the first meaningful structural support below. The risk-reward ratio is about 1.9, sufficient to compensate for the stop-loss risk. The main risks are a short-term buying surge that breaks through resistance and triggers the stop-loss, or the price failing to break down and continuing to fluctuate within the range. #BTC #BTC Price Analysis
$BTC The structure is bearish. The price has continued to retreat from a high near 78854 to around 77000, and the rebound has been weak. Sellers have clearly dominated over the past several periods, while funds have continued to flow out on both the 1-hour and daily charts. Net aggressive selling over the past 24 hours has been approximately 5,900 coins. The upper Bollinger Band around 77264 is the main resistance; a rebound to that level would encounter pressure. The current rebound is too weak to reach the ideal limit-order entry, so entering a short at market now is more practical, with 77000 as a reference entry price. Place the stop-loss above the upper Bollinger Band at 77341. If the price holds above that level, the rebound has exceeded expectations and the bearish structure is invalidated; exit and accept the loss. The target is 76340, the first meaningful structural support below. The risk-reward ratio is about 1.9, sufficient to compensate for the stop-loss risk. The main risks are a short-term buying surge that breaks through resistance and triggers the stop-loss, or the price failing to break down and continuing to fluctuate within the range. #BTC #BTC Price Analysis
9
Log in to explore more content
Join global crypto users on Binance Square
⚡️ Get latest and useful information about crypto.
💬 Trusted by the world’s largest crypto exchange.
👍 Discover real insights from verified creators.
Email / Phone number
Trending Topics
BTCRebounds80K
8,763 views
368 Discussing
#btcrebounds80k Bitcoin has made a sharp recovery, jumping over 4% to reclaim the $80,000 level. This price jump came right after a temporary drop below $76,000. Lower crude oil prices and heavy option market bets helped push the crypto market back up. Over $370 million in short trades were wiped out in a huge wave of market liquidations during the surge. Traders are now watching to see if Bitcoin can stay above $80,000 and keep moving toward higher target levels.
$BTC $SOL $ETH
Jojo_1122
·0 Likes
·4.4k views
Binance98PercentReplenished
11,531 views
380 Discussing
USMidterms-WhatAreMarketsExpecting?
251,783 views
1,843 Discussing