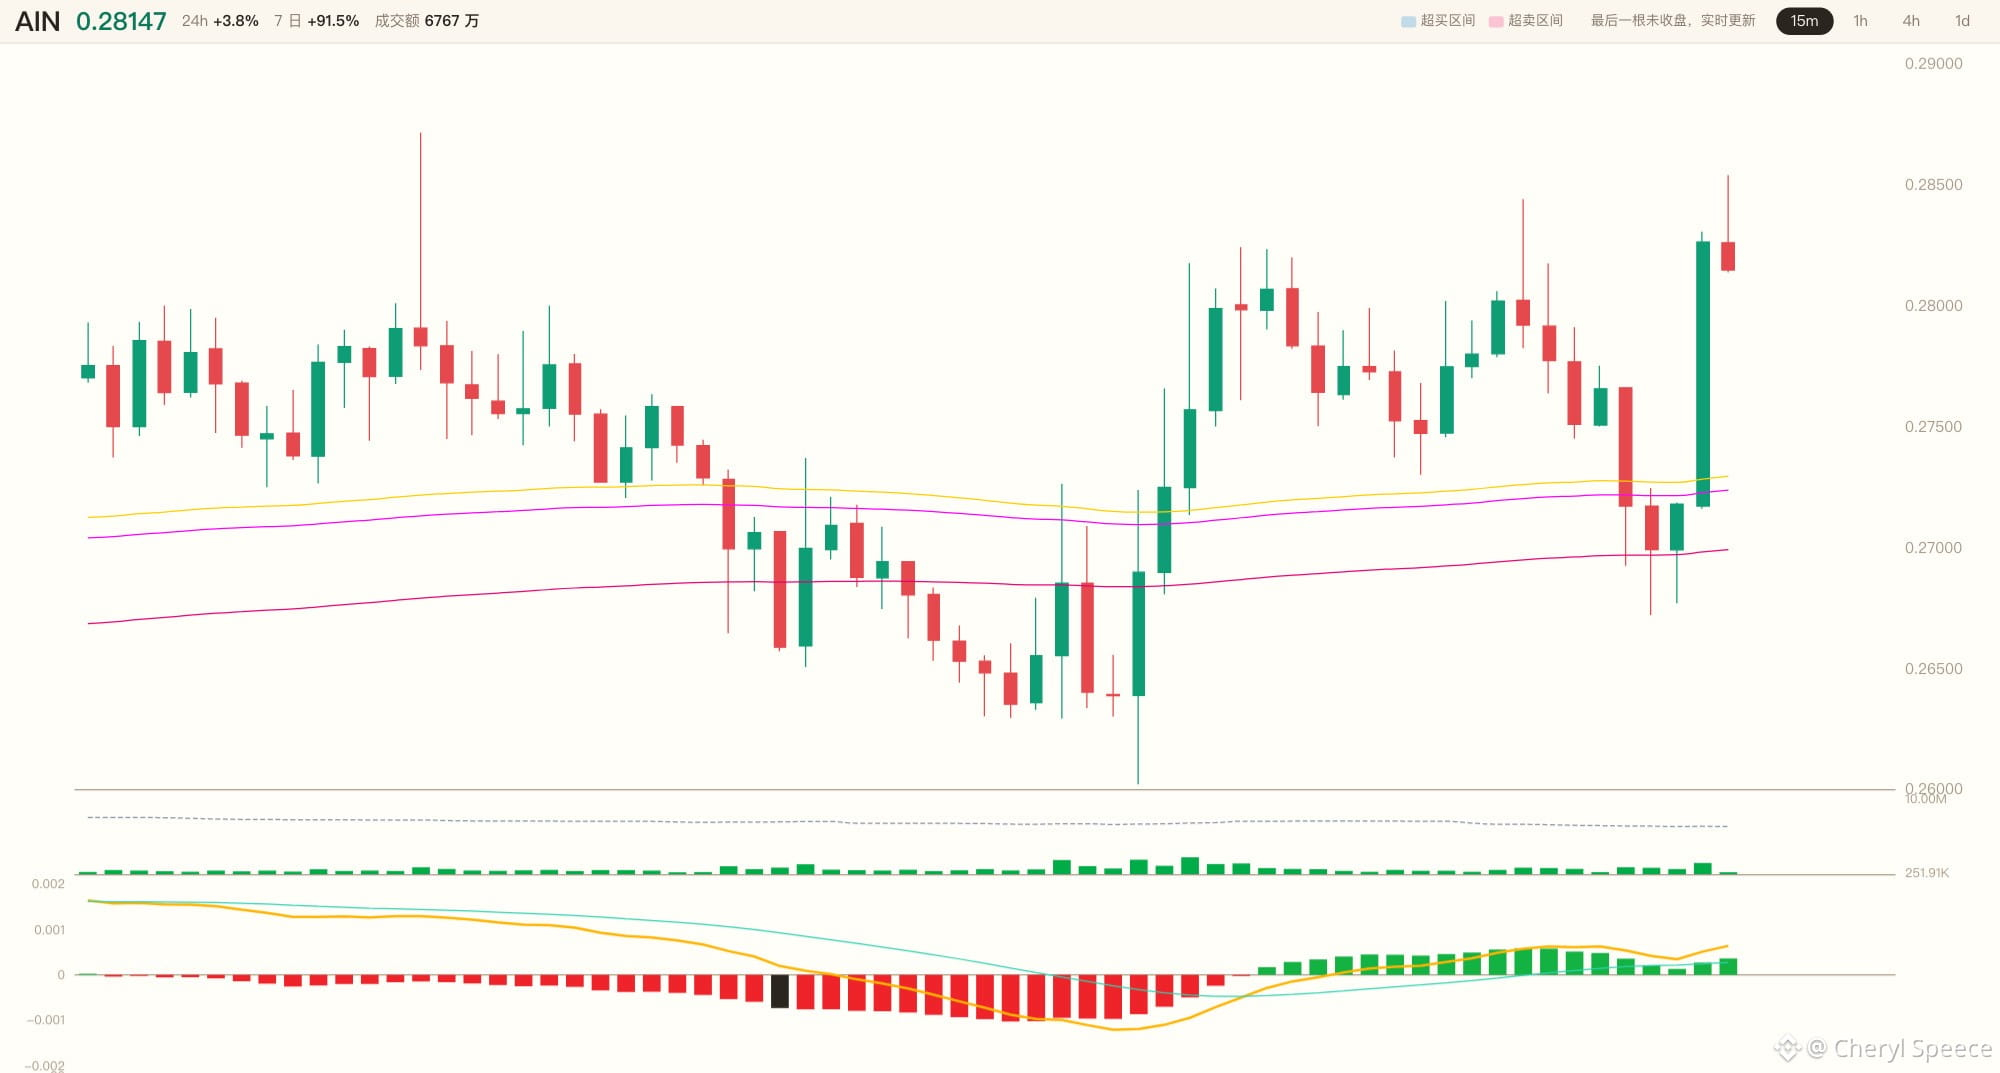
😤 0.28263— all eight conditions are flashing green, but I’m watching the screen and not rushing in.
$AIN This 15-minute candle closed 3.59% above the moving-average cluster, with CCI at 134.7 and the MACD histogram at 0.00027. The bullish alignment has held for all of the last 96 candles, and the close is still near the top, at 96% of the candle’s range.
🔥 Here’s the bull-bear breakdown: on one side, the 15m, 1h, and 4h charts are all above the cluster, and momentum is strengthening again. On the other, the 1d chart is still tangled up in the moving averages— that light hasn’t turned green.
💀 I’m not chasing the price, but I’m taking this setup. Going long with a small position: entry at 0.28263, stop loss at 0.25890. I can live with an 8.4% loss; if it breaks below, I’m out.
👀 0.28263 is the current price, while 0.25890 is the line in the sand I’ve drawn. Will it keep pushing along the cluster, or pull back first before making its next move?
Here are the three charts. Are you betting it keeps rising from here, or drops back toward 0.25890 first? Pick a side in the comments. 🤔
#ETH #BTC $ETH $BTC
$AIN This 15-minute candle closed 3.59% above the moving-average cluster, with CCI at 134.7 and the MACD histogram at 0.00027. The bullish alignment has held for all of the last 96 candles, and the close is still near the top, at 96% of the candle’s range.
🔥 Here’s the bull-bear breakdown: on one side, the 15m, 1h, and 4h charts are all above the cluster, and momentum is strengthening again. On the other, the 1d chart is still tangled up in the moving averages— that light hasn’t turned green.
💀 I’m not chasing the price, but I’m taking this setup. Going long with a small position: entry at 0.28263, stop loss at 0.25890. I can live with an 8.4% loss; if it breaks below, I’m out.
👀 0.28263 is the current price, while 0.25890 is the line in the sand I’ve drawn. Will it keep pushing along the cluster, or pull back first before making its next move?
Here are the three charts. Are you betting it keeps rising from here, or drops back toward 0.25890 first? Pick a side in the comments. 🤔
#ETH #BTC $ETH $BTC