【$SOL Key-Level Showdown: Bullish Conditions and Invalidation Conditions Explained】
【Hot Event】
The news surrounding SOL came suddenly, but the market action is telling the truth.
“Binance hackers move 81% of stolen Solana, route funds via THORChain” — Cointelegraph reported that the Binance attackers moved most of the stolen SOL and continued laundering funds through THORChain after the…
The news is just the catalyst; ultimately, pricing still depends on how supply and volume interact.
【Market Snapshot】
$SOL is currently at 96.640, up 3.32% over 24 hours, with 24h trading volume of approximately 246.0M USDT.
【Technical Breakdown】
· Moving averages: MA5>MA10>MA20>MA60, a standard bullish alignment; short- and medium-term cost bases are both rising
· Momentum: The MACD fast line is above the zero axis, with red bars prevailing, so bullish momentum is continuing; RSI(72) has entered overbought territory, making it less attractive to chase the price higher
· Pattern: Price is close to the upper Bollinger Band, with a breakout or pullback hinging on a fine line; volume is shrinking (0.3 times the average), so directional signals should be taken with a grain of salt in these low-volume conditions
【Directional Outlook】
Overall score: 55/100. The structure is leaning bullish: moving averages and momentum indicators are aligned to the upside. Until a pullback breaks below the lower boundary of the entry zone, the preference is to scale in on dips; a break above the previous high could target the second objective. If price breaks below the stop-loss level on increased volume, this outlook is invalidated.
【Trading Plan Reference】
· Strategy: Buy dips
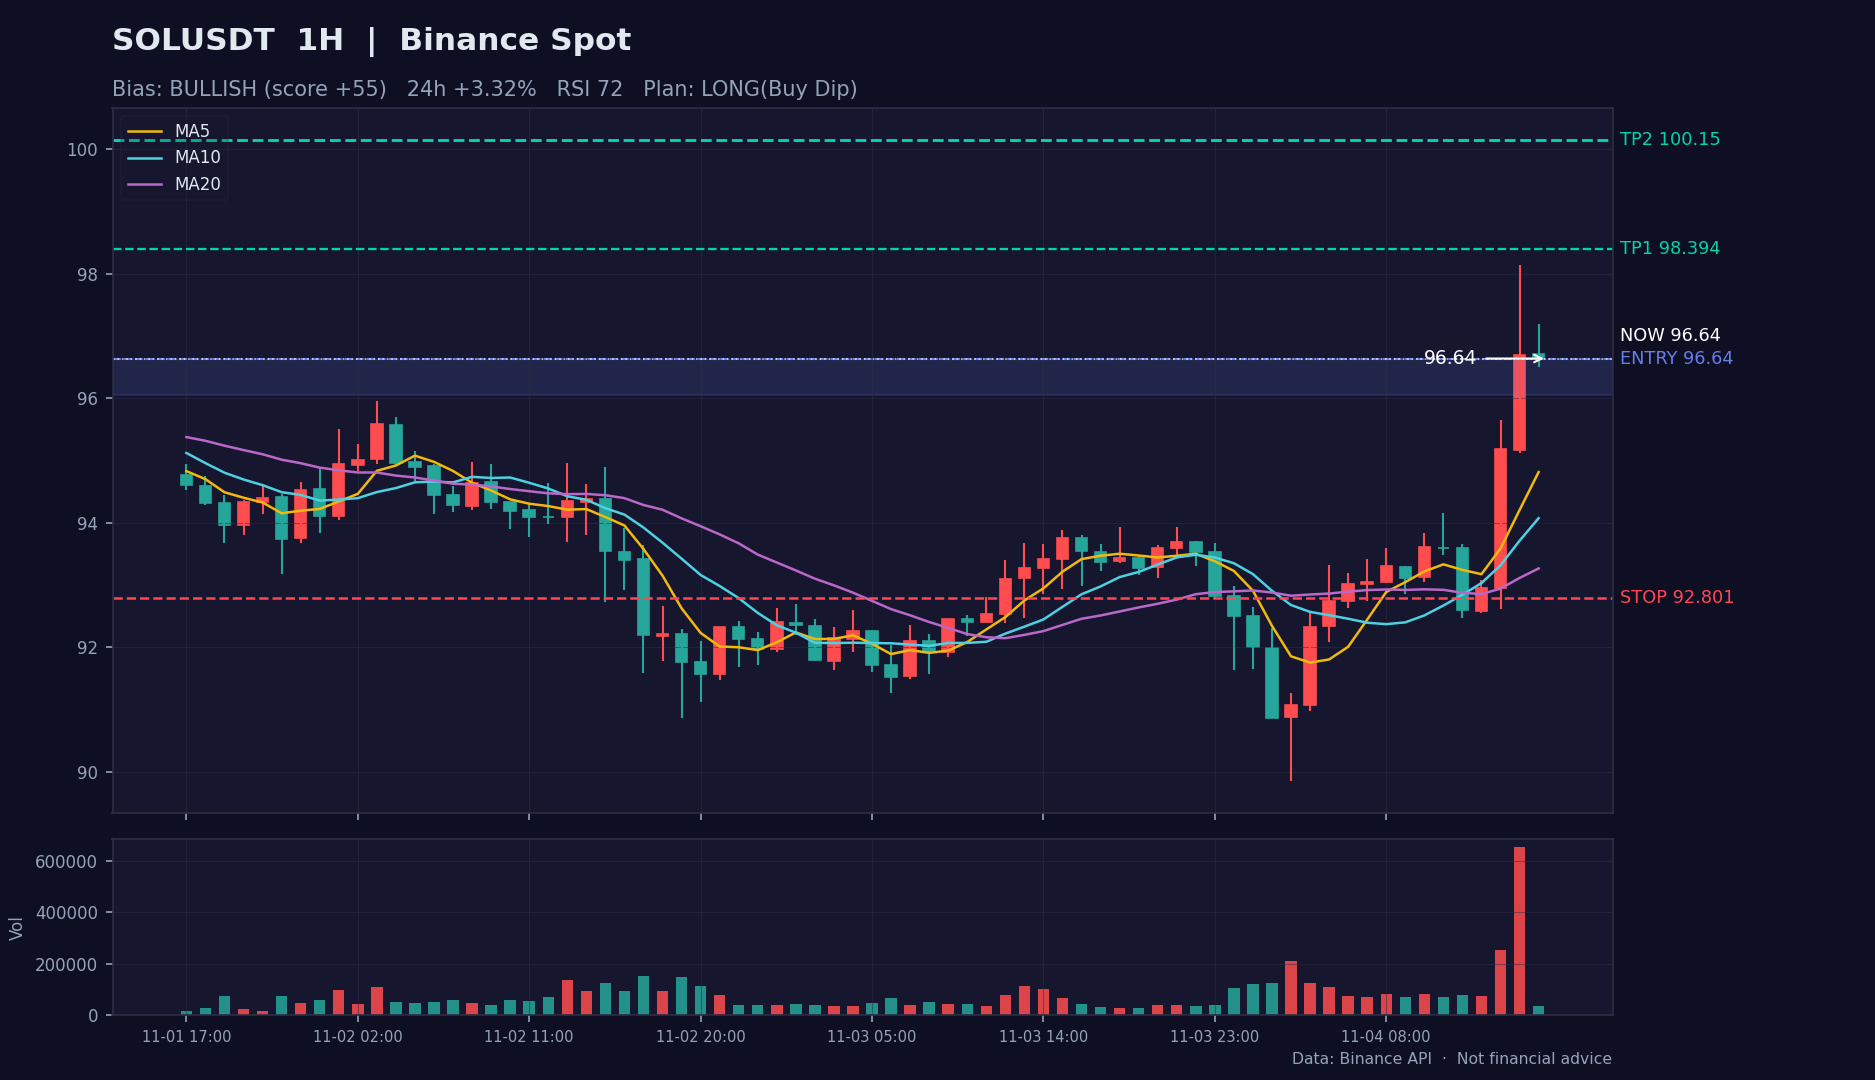
· Entry zone: 96.055 ~ 96.640
· Take profit: First target 98.394, second target 100.15
· Stop loss: 92.801
· Position size: Small, 5%-10%; strictly exit if price breaks below the stop-loss level
· Chart: Candlestick analysis chart included in the post (1-hour chart, red for rising and green for falling; entry zone/take-profit/stop-loss marked with colored lines)
【Risk Warning】Smaller-cap coins are highly volatile, and event-driven rallies can retrace quickly. Be sure to keep position sizes under control.
The above is only my personal review and technical analysis notes, and does not constitute any investment advice. DYOR.
$SOL #SOL #加密货币 #MarketAnalysis
【Hot Event】
The news surrounding SOL came suddenly, but the market action is telling the truth.
“Binance hackers move 81% of stolen Solana, route funds via THORChain” — Cointelegraph reported that the Binance attackers moved most of the stolen SOL and continued laundering funds through THORChain after the…
The news is just the catalyst; ultimately, pricing still depends on how supply and volume interact.
【Market Snapshot】
$SOL is currently at 96.640, up 3.32% over 24 hours, with 24h trading volume of approximately 246.0M USDT.
【Technical Breakdown】
· Moving averages: MA5>MA10>MA20>MA60, a standard bullish alignment; short- and medium-term cost bases are both rising
· Momentum: The MACD fast line is above the zero axis, with red bars prevailing, so bullish momentum is continuing; RSI(72) has entered overbought territory, making it less attractive to chase the price higher
· Pattern: Price is close to the upper Bollinger Band, with a breakout or pullback hinging on a fine line; volume is shrinking (0.3 times the average), so directional signals should be taken with a grain of salt in these low-volume conditions
【Directional Outlook】
Overall score: 55/100. The structure is leaning bullish: moving averages and momentum indicators are aligned to the upside. Until a pullback breaks below the lower boundary of the entry zone, the preference is to scale in on dips; a break above the previous high could target the second objective. If price breaks below the stop-loss level on increased volume, this outlook is invalidated.
【Trading Plan Reference】
· Strategy: Buy dips
· Entry zone: 96.055 ~ 96.640
· Take profit: First target 98.394, second target 100.15
· Stop loss: 92.801
· Position size: Small, 5%-10%; strictly exit if price breaks below the stop-loss level
· Chart: Candlestick analysis chart included in the post (1-hour chart, red for rising and green for falling; entry zone/take-profit/stop-loss marked with colored lines)
【Risk Warning】Smaller-cap coins are highly volatile, and event-driven rallies can retrace quickly. Be sure to keep position sizes under control.
The above is only my personal review and technical analysis notes, and does not constitute any investment advice. DYOR.
$SOL #SOL #加密货币 #MarketAnalysis