
$LSK A Falling Channel Finally Meets Buying Pressure
The prolonged decline is showing signs of exhaustion. LSK is attempting to turn its recovery into a fresh bullish continuation, but the next resistance levels will determine how far this move can extend.
Long Setup
Entry Zone: 0.1860 – 0.1950
Stop Loss: 0.1780
TP1: 0.2236
TP2: 0.2579
TP3: 0.2923
Why This Setup?
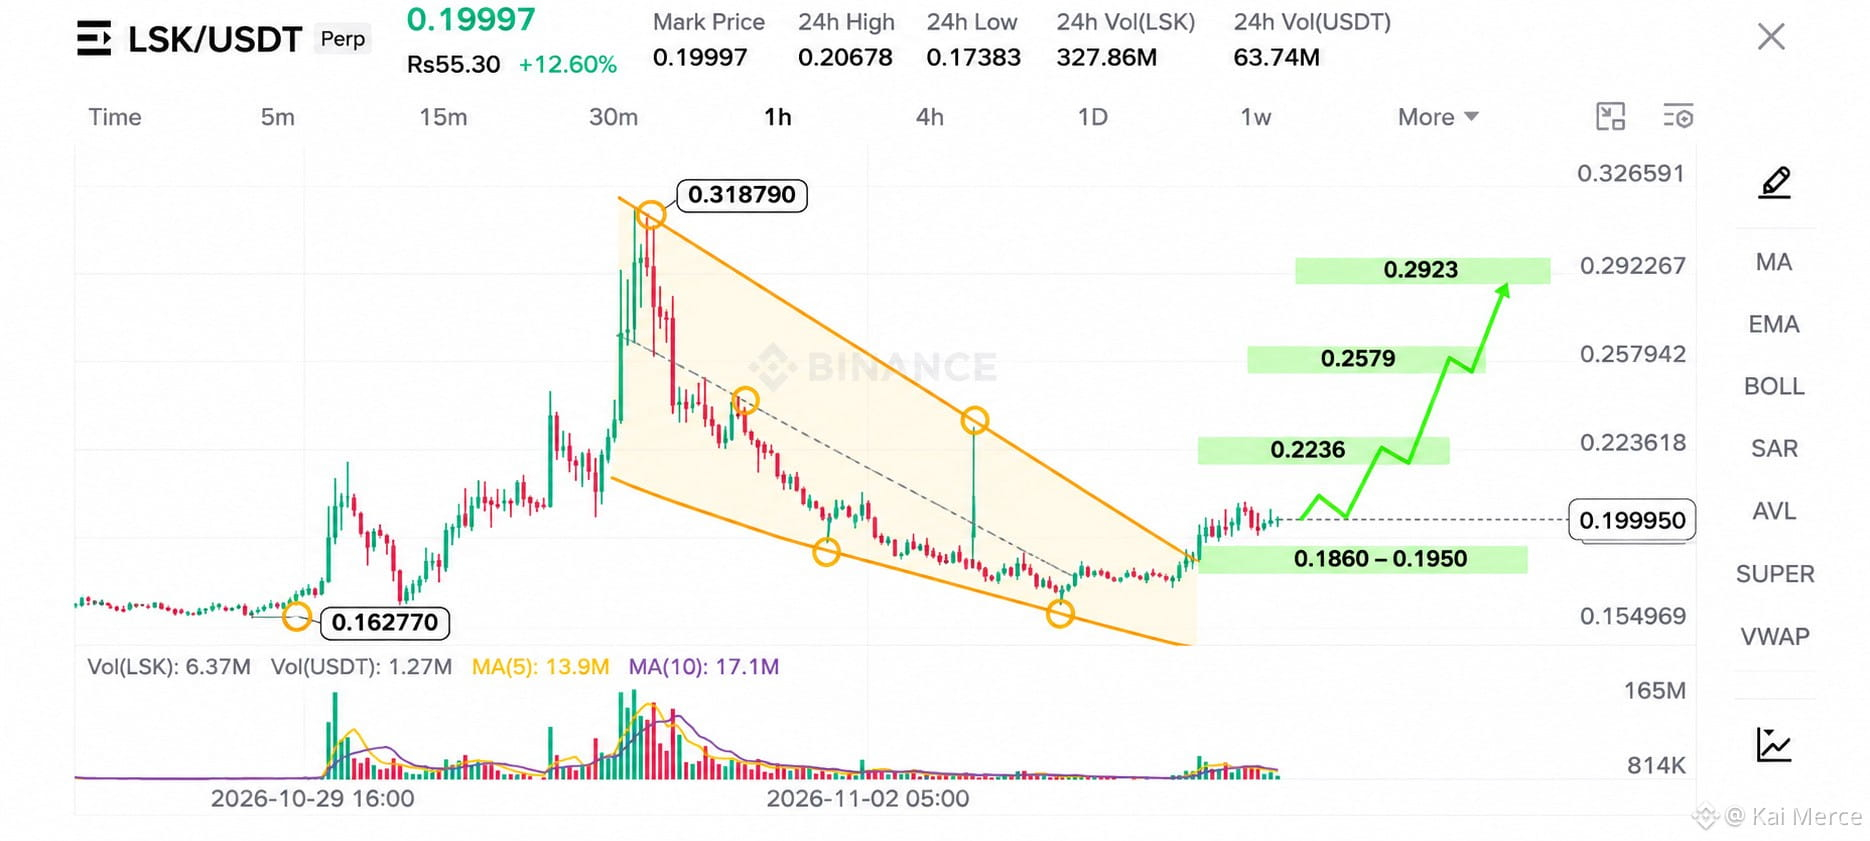
LSK has recovered from its recent low near 0.16277 after spending several sessions inside a descending channel. The latest price action suggests buyers are gradually regaining control, with price now trading around 0.19997.
The former falling-channel structure is important here. A sustained move above its upper boundary could strengthen the bullish reversal and attract additional buying pressure.
The 0.1860–0.1950 region is the key area to watch for a potential pullback. If this zone holds as support, the first upside objective sits near 0.2236. A successful breakout above that level could open the way toward 0.2579 and eventually 0.2923.
Confirmation: A strong 1H candle close above 0.2068 would provide additional bullish confirmation.
Invalidation: A breakdown below 0.1780 would weaken the recovery setup.
The preferred approach is to wait for a controlled retest rather than chase the current upward move.
Risk only 1–3% of your trading deposit per trade. Always manage your risk.
The prolonged decline is showing signs of exhaustion. LSK is attempting to turn its recovery into a fresh bullish continuation, but the next resistance levels will determine how far this move can extend.
Long Setup
Entry Zone: 0.1860 – 0.1950
Stop Loss: 0.1780
TP1: 0.2236
TP2: 0.2579
TP3: 0.2923
Why This Setup?
LSK has recovered from its recent low near 0.16277 after spending several sessions inside a descending channel. The latest price action suggests buyers are gradually regaining control, with price now trading around 0.19997.
The former falling-channel structure is important here. A sustained move above its upper boundary could strengthen the bullish reversal and attract additional buying pressure.
The 0.1860–0.1950 region is the key area to watch for a potential pullback. If this zone holds as support, the first upside objective sits near 0.2236. A successful breakout above that level could open the way toward 0.2579 and eventually 0.2923.
Confirmation: A strong 1H candle close above 0.2068 would provide additional bullish confirmation.
Invalidation: A breakdown below 0.1780 would weaken the recovery setup.
The preferred approach is to wait for a controlled retest rather than chase the current upward move.
Risk only 1–3% of your trading deposit per trade. Always manage your risk.