$XLM / $S / $ENA : 4-hour technical indicators are strengthening simultaneously. Which has greater breakout potential? 🔥
════════════════════
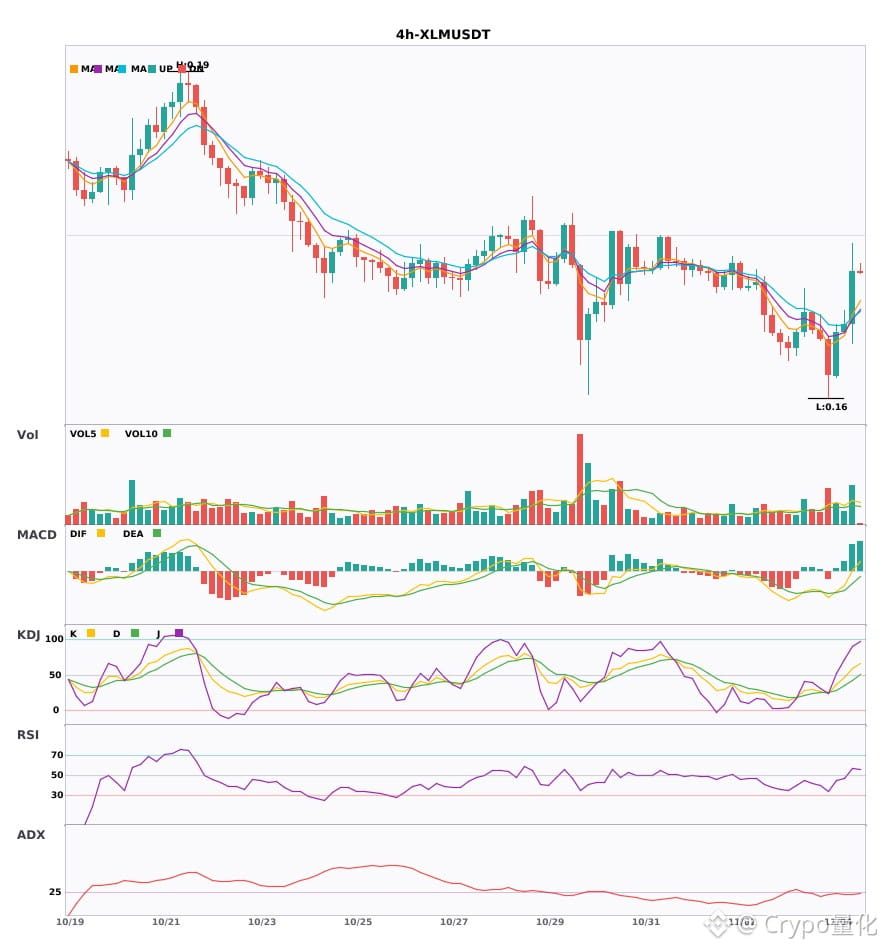
🔴 $XLM 4-hour bullish signal
⚠️Technical analysis: ADX(25): Trend is forming; entry is possible | MACD DIF breaks above the zero line; trend turns bullish | EMA5 crosses above EMA8; short-term trend turns bullish | Volume increases (2.0x)
════════════════════
🔴 $S 4-hour bullish signal
⚠️Technical analysis: ADX(32): Clear trending market | MACD is bullish, trend is strong, momentum is increasing | EMA5 > EMA8 > EMA13: bullish alignment | KDJ is strong, bulls have the upper hand (K: 69.6, D: 56.2) | Volume surges (3.0x)
════════════════════
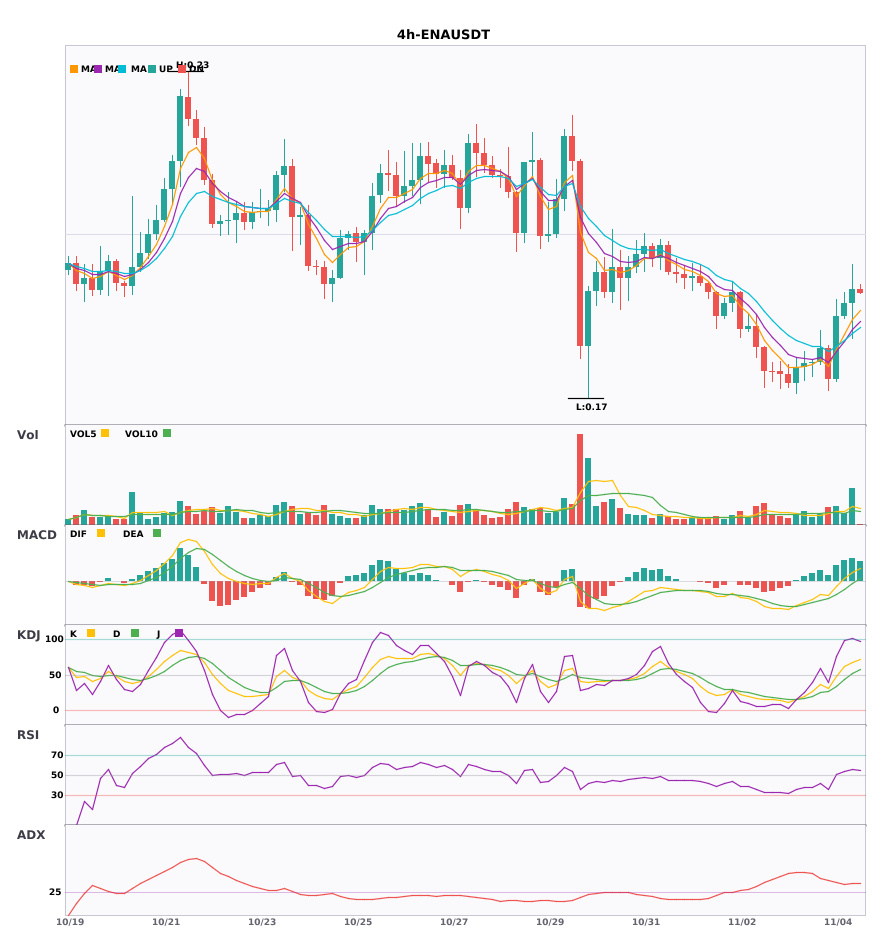
🔴 $ENA 4-hour bullish signal
⚠️Technical analysis: ADX(37): Clear trending market | MACD is bullish, trend is strong, momentum is increasing | EMA5 > EMA8 > EMA13: bullish alignment | KDJ is strong, bulls have the upper hand (K: 68.1, D: 51.8) | Volume surges (2.6x)
════════════════════
🔔 Follow for first-hand market updates 🔔
#技术分析 #XLM #S #ENA
📌 When trading, check whether the candlestick pattern confirms the signal
════════════════════
🔴 $XLM 4-hour bullish signal
⚠️Technical analysis: ADX(25): Trend is forming; entry is possible | MACD DIF breaks above the zero line; trend turns bullish | EMA5 crosses above EMA8; short-term trend turns bullish | Volume increases (2.0x)
════════════════════
🔴 $S 4-hour bullish signal
⚠️Technical analysis: ADX(32): Clear trending market | MACD is bullish, trend is strong, momentum is increasing | EMA5 > EMA8 > EMA13: bullish alignment | KDJ is strong, bulls have the upper hand (K: 69.6, D: 56.2) | Volume surges (3.0x)
════════════════════
🔴 $ENA 4-hour bullish signal
⚠️Technical analysis: ADX(37): Clear trending market | MACD is bullish, trend is strong, momentum is increasing | EMA5 > EMA8 > EMA13: bullish alignment | KDJ is strong, bulls have the upper hand (K: 68.1, D: 51.8) | Volume surges (2.6x)
════════════════════
🔔 Follow for first-hand market updates 🔔
#技术分析 #XLM #S #ENA
📌 When trading, check whether the candlestick pattern confirms the signal