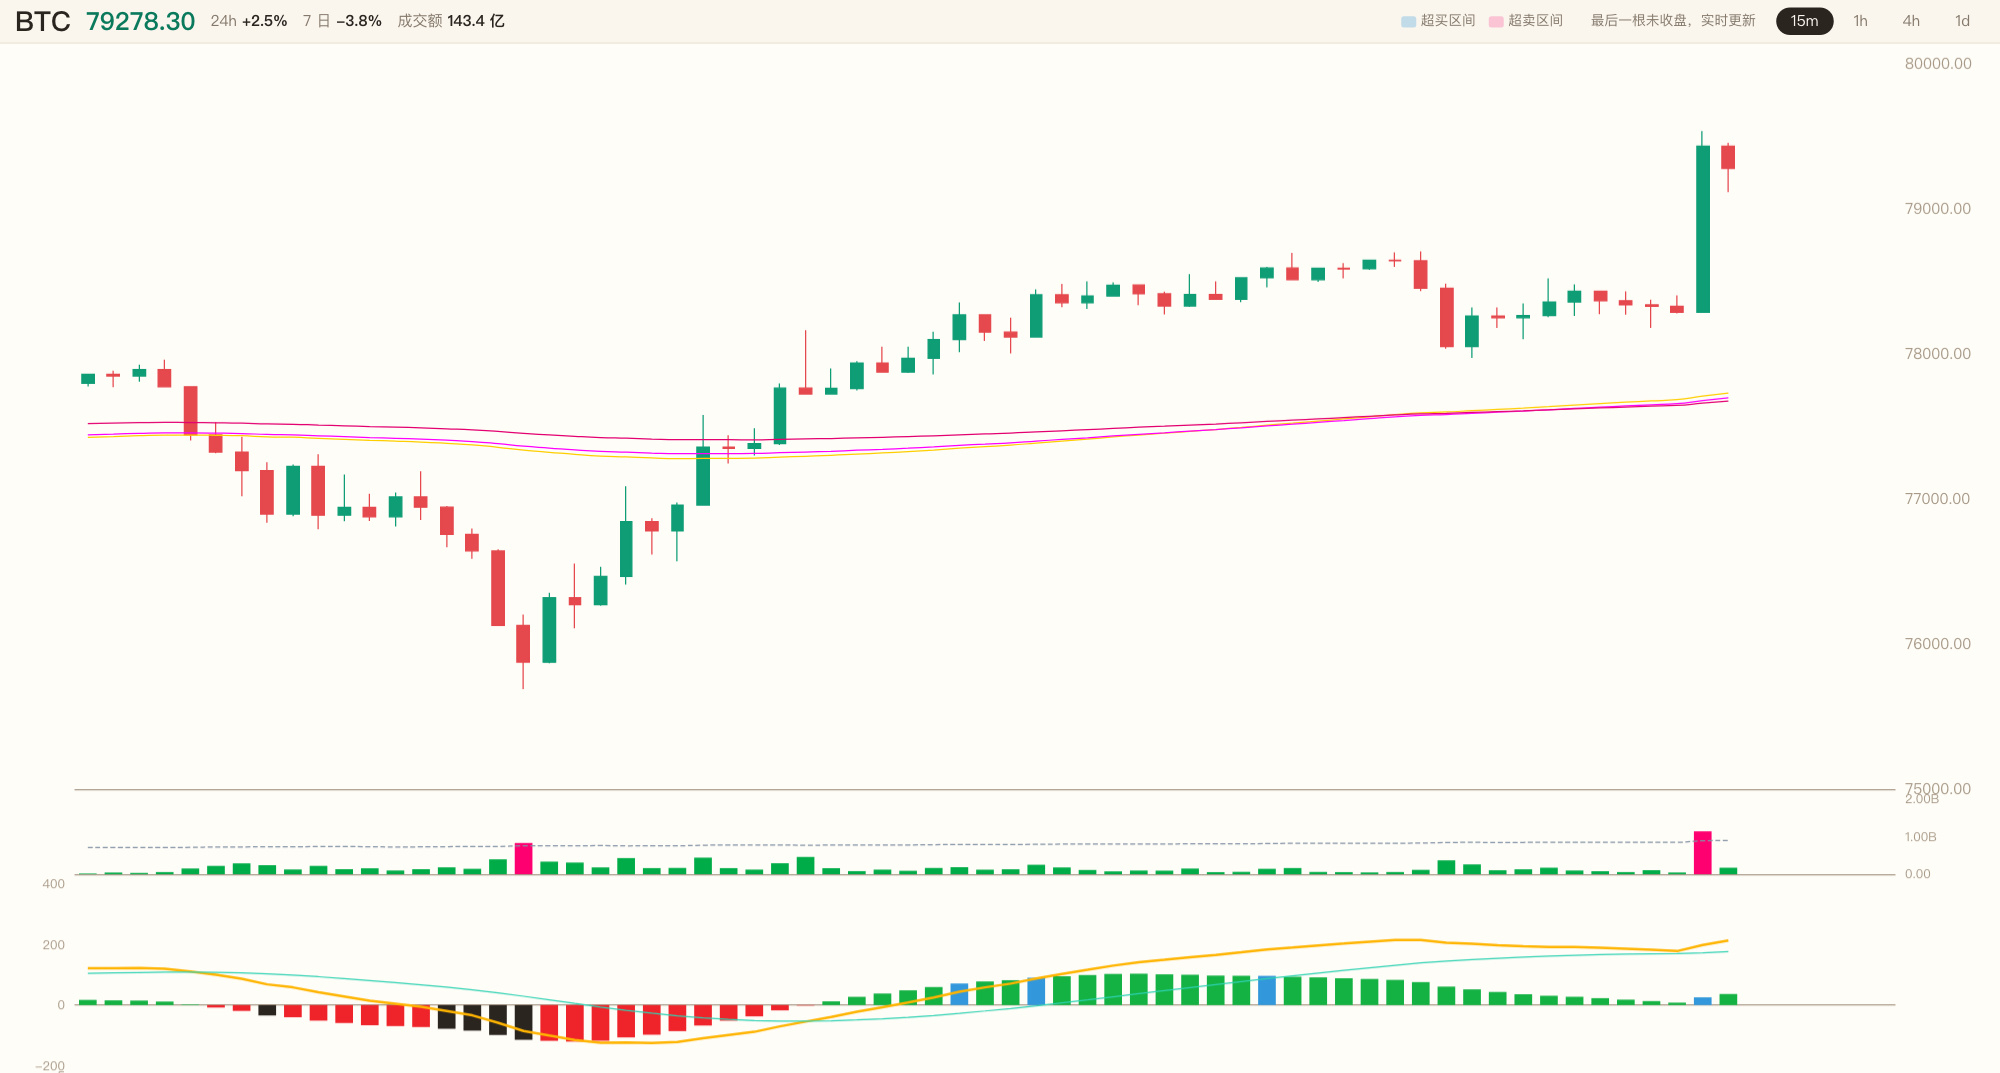
😤 10.2x volume—a single candle smashed through the 78706.80 ceiling that had held for 12 hours, closing at 79432.50.
$BTC That 15-minute move had real volume, and the breakout was real too. I stared at the screen for two seconds.
💀 But when I laid out the conditions one by one, all seven were flashing green: 15m bullish alignment, three lines converging, CCI at 223.8, MACD histogram at 25, and the close still sitting near the 92% high of the candle.
🔥 The thing is, the 1h is still bouncing within a bearish trend, and the 4h is below the cluster. The higher timeframes haven't given the green light, so I can't touch this trade.
👀 So I'm not entering. The plan is an entry at 79432.50 and a stop-loss at 77582.54. I'm willing to accept a 2.3% loss, but I'm not executing it now—not because I'm afraid, but because the 1h light hasn't turned green. I don't want to jump the gun against the trend.
⚡ 79432.50 is the level it just broke through; 77582.54 is the line in the sand I've drawn. Will it hold steady first and wait for the 1h to catch up, or will this surge fizzle out first?
Here are the three charts. Are you betting it rides the volume higher, or pulls back after the spike before making another move? Pick a side in the comments. 🤔
#ETH #BTC $ETH $BTC
$BTC That 15-minute move had real volume, and the breakout was real too. I stared at the screen for two seconds.
💀 But when I laid out the conditions one by one, all seven were flashing green: 15m bullish alignment, three lines converging, CCI at 223.8, MACD histogram at 25, and the close still sitting near the 92% high of the candle.
🔥 The thing is, the 1h is still bouncing within a bearish trend, and the 4h is below the cluster. The higher timeframes haven't given the green light, so I can't touch this trade.
👀 So I'm not entering. The plan is an entry at 79432.50 and a stop-loss at 77582.54. I'm willing to accept a 2.3% loss, but I'm not executing it now—not because I'm afraid, but because the 1h light hasn't turned green. I don't want to jump the gun against the trend.
⚡ 79432.50 is the level it just broke through; 77582.54 is the line in the sand I've drawn. Will it hold steady first and wait for the 1h to catch up, or will this surge fizzle out first?
Here are the three charts. Are you betting it rides the volume higher, or pulls back after the spike before making another move? Pick a side in the comments. 🤔
#ETH #BTC $ETH $BTC