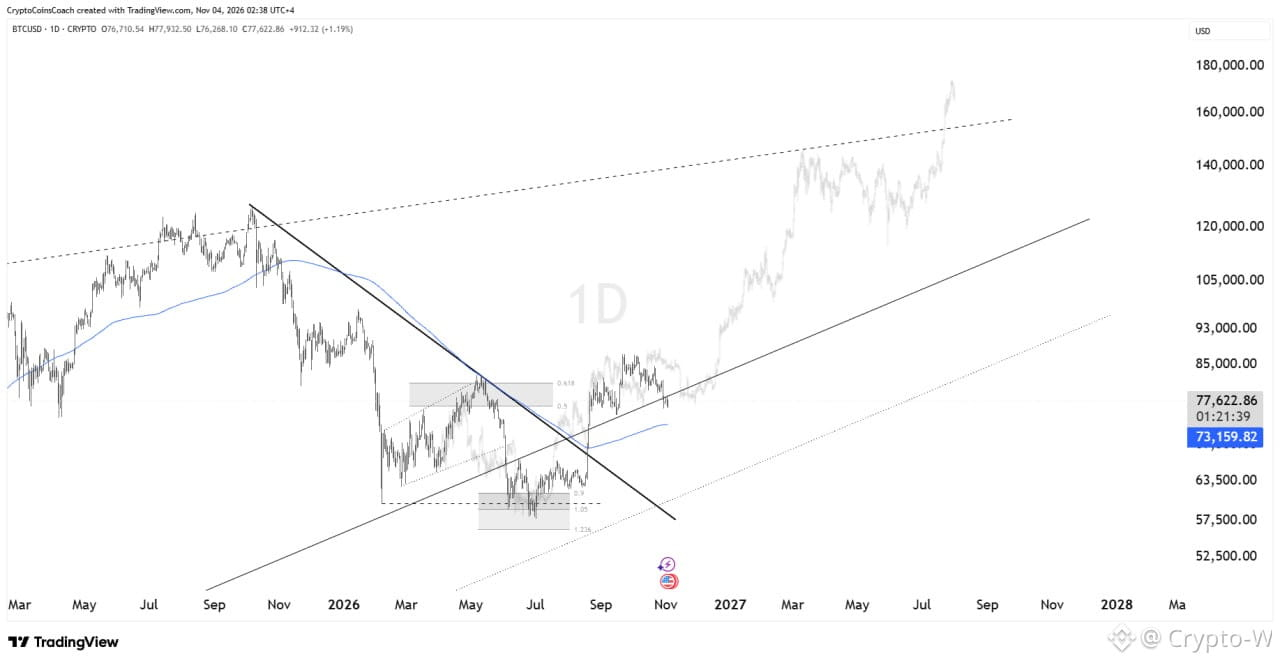
#BTCUSDT appears to be preparing for a larger bullish reversal after breaking through the previous descending resistance structure.
BTC is currently trading around $77,622 $ and the daily chart shows an interesting setup. The price has already broken above the main descending trendline that dominated the previous downtrend; the recent correction could be a retest of the newly formed ascending support structure.
The 200-day moving average is currently near $73,159, another important level I’m watching.
For this bullish setup to take hold, BTC needs to stay above the support zone between $75,000 $ and $73,000, and reclaim the resistance zone between $80,000 $ and $83,000.
If BTC manages to hold this support and breaks above $83,000, the next upside levels I’m watching are between $90,000 $ and $95,000, followed by the $105,000 $ to $120,000 range.
If the broader bullish structure continues to develop, levels between $140,000 $ and $160,000 $ (or higher) could come into play. However, these are potential longer-term targets, not confirmed price projections.#BTC #Binance
BTC is currently trading around $77,622 $ and the daily chart shows an interesting setup. The price has already broken above the main descending trendline that dominated the previous downtrend; the recent correction could be a retest of the newly formed ascending support structure.
The 200-day moving average is currently near $73,159, another important level I’m watching.
For this bullish setup to take hold, BTC needs to stay above the support zone between $75,000 $ and $73,000, and reclaim the resistance zone between $80,000 $ and $83,000.
If BTC manages to hold this support and breaks above $83,000, the next upside levels I’m watching are between $90,000 $ and $95,000, followed by the $105,000 $ to $120,000 range.
If the broader bullish structure continues to develop, levels between $140,000 $ and $160,000 $ (or higher) could come into play. However, these are potential longer-term targets, not confirmed price projections.#BTC #Binance