WHAT IS VOLUME TELLING US?
Today’s $BTC 4H chart study | 4 Nov 2026
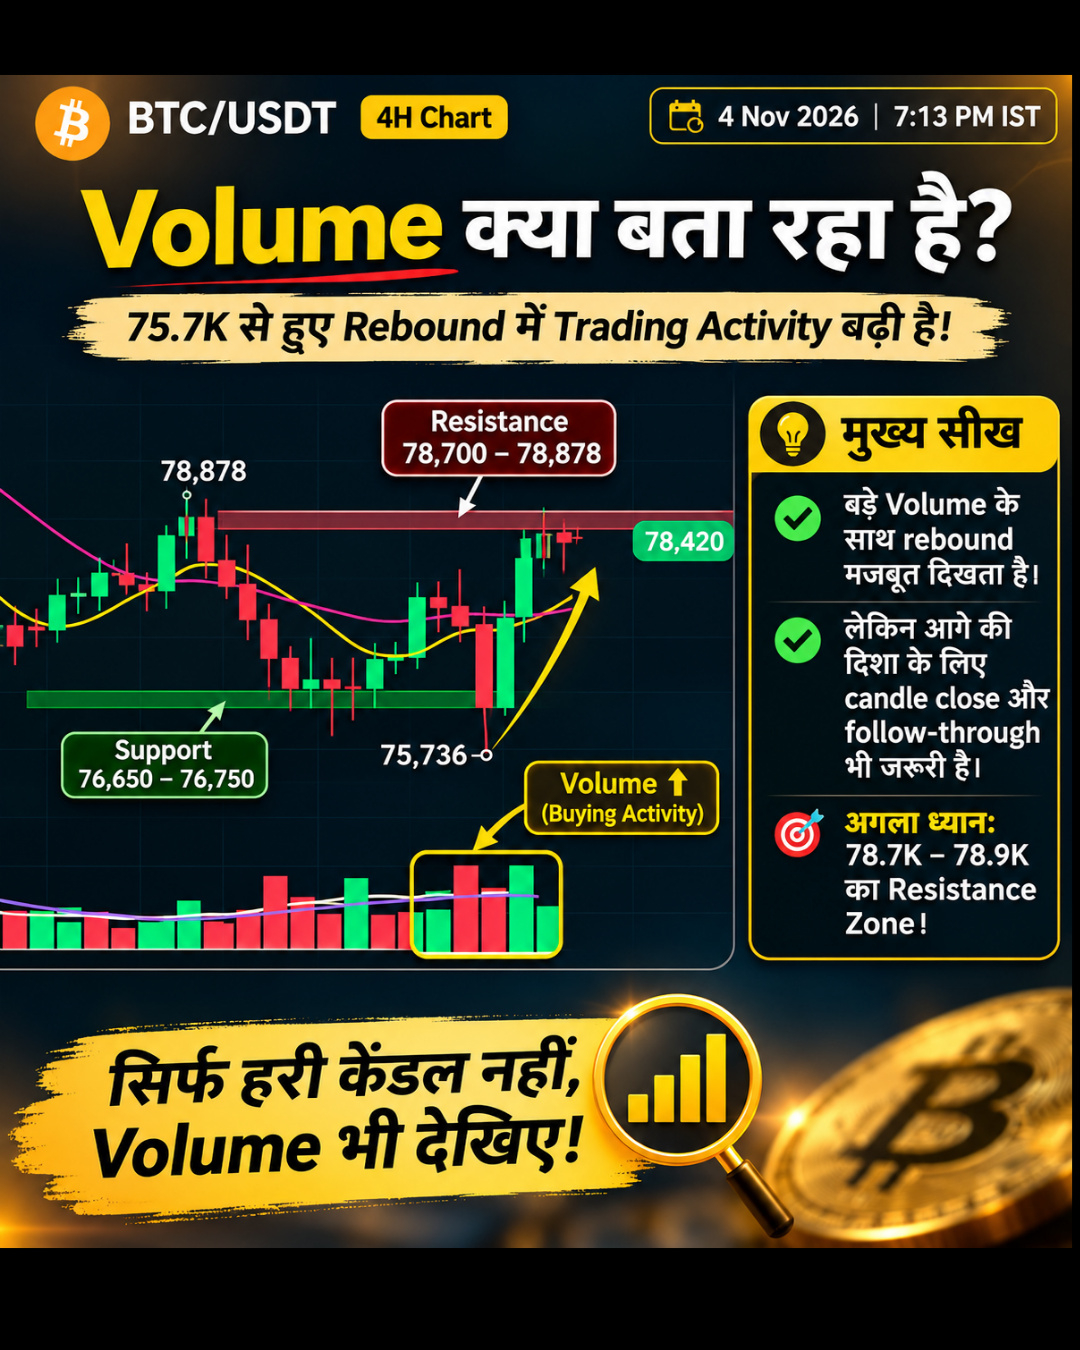
BTC rebounded from the visible 75.7K area toward 78.4K.
During the rebound, several green candles appeared with stronger volume.
But here’s what I’m learning:
Volume shows how much trading activity took place.
Strong volume during a price move can make that move more meaningful to study.
It does not tell us by itself whether price will continue upward.
In this screenshot, the displayed volume is around 1.34K BTC, below the Volume MA(5) and MA(10), both near 2.3K BTC.
I still want to watch the candle close and follow-through near resistance.
My takeaway: Volume helps me judge participation—but price structure and confirmation still matter.
This is a screenshot-based learning observation, not a live trading signal or financial advice.
When you see a strong green candle, what do you check next: volume, candle close, or the next candle’s follow-through?
$BTC
#BTC #VolumeAnalysis #CryptoEducation #ChartStudy #LearnInPublic
Today’s $BTC 4H chart study | 4 Nov 2026
BTC rebounded from the visible 75.7K area toward 78.4K.
During the rebound, several green candles appeared with stronger volume.
But here’s what I’m learning:
Volume shows how much trading activity took place.
Strong volume during a price move can make that move more meaningful to study.
It does not tell us by itself whether price will continue upward.
In this screenshot, the displayed volume is around 1.34K BTC, below the Volume MA(5) and MA(10), both near 2.3K BTC.
I still want to watch the candle close and follow-through near resistance.
My takeaway: Volume helps me judge participation—but price structure and confirmation still matter.
This is a screenshot-based learning observation, not a live trading signal or financial advice.
When you see a strong green candle, what do you check next: volume, candle close, or the next candle’s follow-through?
$BTC
#BTC #VolumeAnalysis #CryptoEducation #ChartStudy #LearnInPublic