$HYPER USDT — Pullback Could Offer a Fresh Buying Opportunity ⚡
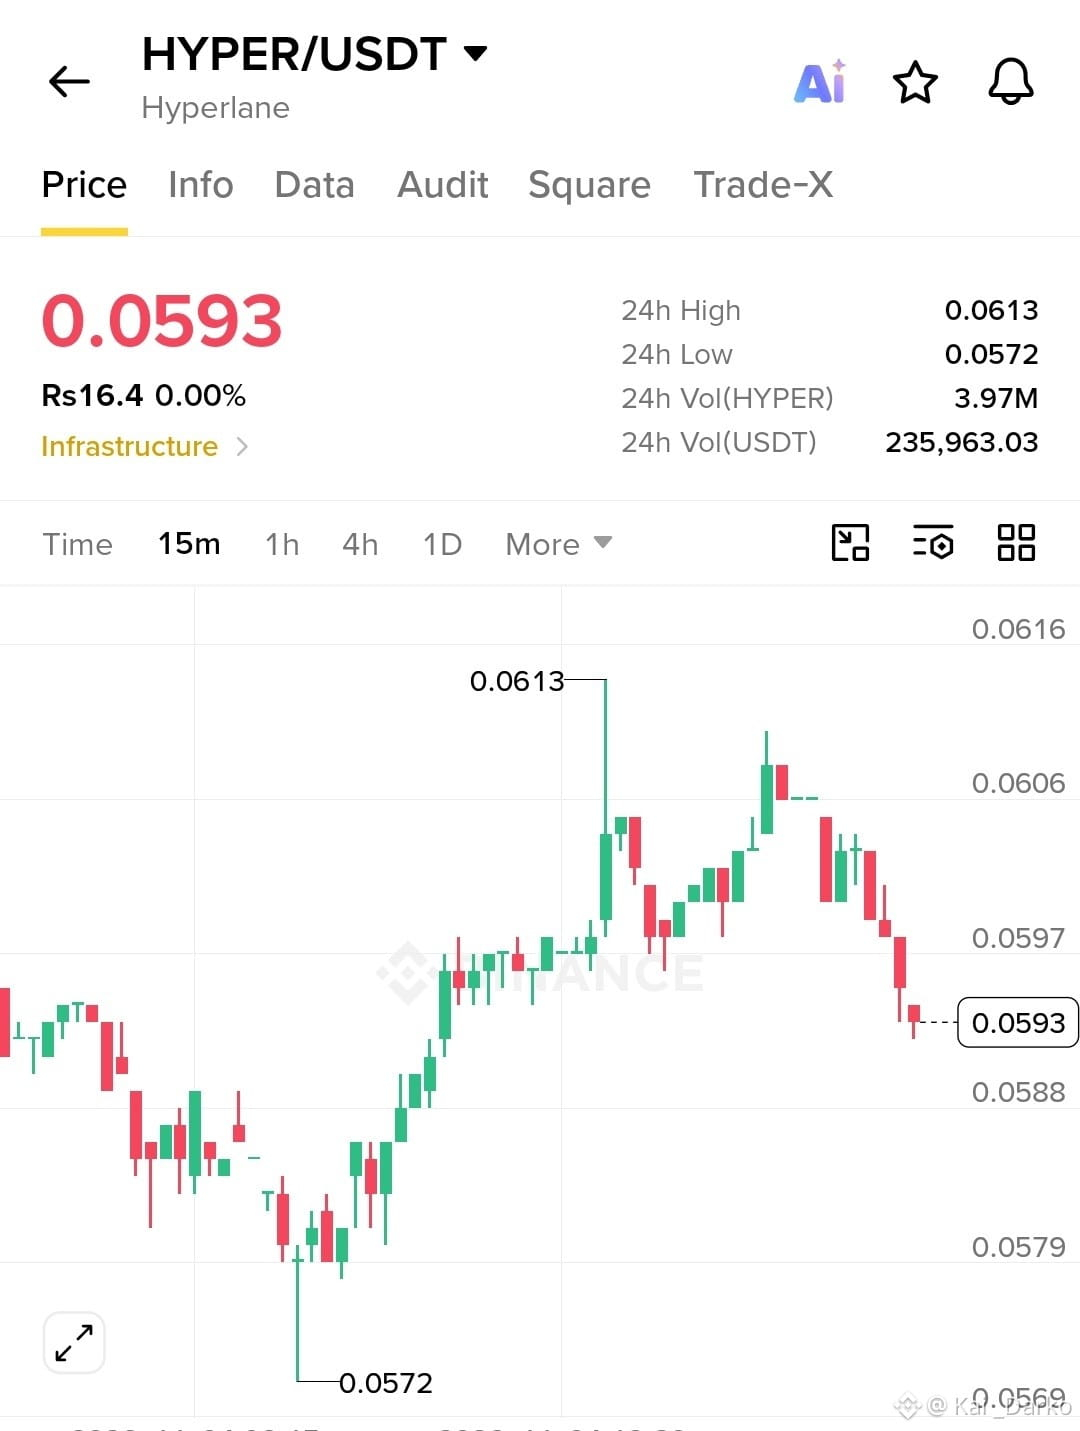
$HYPER is trading around **$0.0593** on the 15-minute chart after recovering strongly from its recent low of **$0.0572** and pushing toward **$0.0613**. However, sellers stepped in near the recent high, triggering a pullback. I’m watching this move carefully because the price is now approaching an important support area.
### Market Structure & Technical Outlook
The recovery from $0.0572 shows that buyers previously stepped in with strength, creating an upward move toward $0.0613. The latest candles, however, show short-term selling pressure and lower highs. The immediate test is whether buyers can defend the $0.0588–$0.0593 region.
This zone also aligns approximately with the 50% and 61.8% Fibonacci retracement levels of the visible $0.0572–$0.0613 move. That makes it an interesting area to watch for a possible bullish reaction.
**Key levels:**
- Support: $0.0588, $0.0579, $0.0572
- Resistance: $0.0597, $0.0606, $0.0613
EMA, RSI and MACD readings are not displayed, so their confirmation cannot be established. The screenshot also does not show candle-by-candle volume.
### 🎯 Trading Plan
**Direction:** Conditional LONG
**Entry Zone:** $0.0588–$0.0593, preferably after bullish confirmation.
**Stop Loss:** $0.0570
**TP1:** $0.0597
**TP2:** $0.0606
**TP3:** $0.0613
### What Comes Next?
If buyers defend the entry zone and reclaim $0.0597, HYPER could attempt another move toward $0.0606 and the previous high at $0.0613. A decisive 15-minute breakdown below $0.0572 would invalidate this bullish idea and increase downside risk.
I would rather wait for confirmation than chase the price. Keep position size sensible, protect capital and consider securing partial profits at each target.
**Are you watching this pullback as a buying opportunity, or do you expect sellers to push HYPER lower?** 👀
$HYPER is trading around **$0.0593** on the 15-minute chart after recovering strongly from its recent low of **$0.0572** and pushing toward **$0.0613**. However, sellers stepped in near the recent high, triggering a pullback. I’m watching this move carefully because the price is now approaching an important support area.
### Market Structure & Technical Outlook
The recovery from $0.0572 shows that buyers previously stepped in with strength, creating an upward move toward $0.0613. The latest candles, however, show short-term selling pressure and lower highs. The immediate test is whether buyers can defend the $0.0588–$0.0593 region.
This zone also aligns approximately with the 50% and 61.8% Fibonacci retracement levels of the visible $0.0572–$0.0613 move. That makes it an interesting area to watch for a possible bullish reaction.
**Key levels:**
- Support: $0.0588, $0.0579, $0.0572
- Resistance: $0.0597, $0.0606, $0.0613
EMA, RSI and MACD readings are not displayed, so their confirmation cannot be established. The screenshot also does not show candle-by-candle volume.
### 🎯 Trading Plan
**Direction:** Conditional LONG
**Entry Zone:** $0.0588–$0.0593, preferably after bullish confirmation.
**Stop Loss:** $0.0570
**TP1:** $0.0597
**TP2:** $0.0606
**TP3:** $0.0613
### What Comes Next?
If buyers defend the entry zone and reclaim $0.0597, HYPER could attempt another move toward $0.0606 and the previous high at $0.0613. A decisive 15-minute breakdown below $0.0572 would invalidate this bullish idea and increase downside risk.
I would rather wait for confirmation than chase the price. Keep position size sensible, protect capital and consider securing partial profits at each target.
**Are you watching this pullback as a buying opportunity, or do you expect sellers to push HYPER lower?** 👀