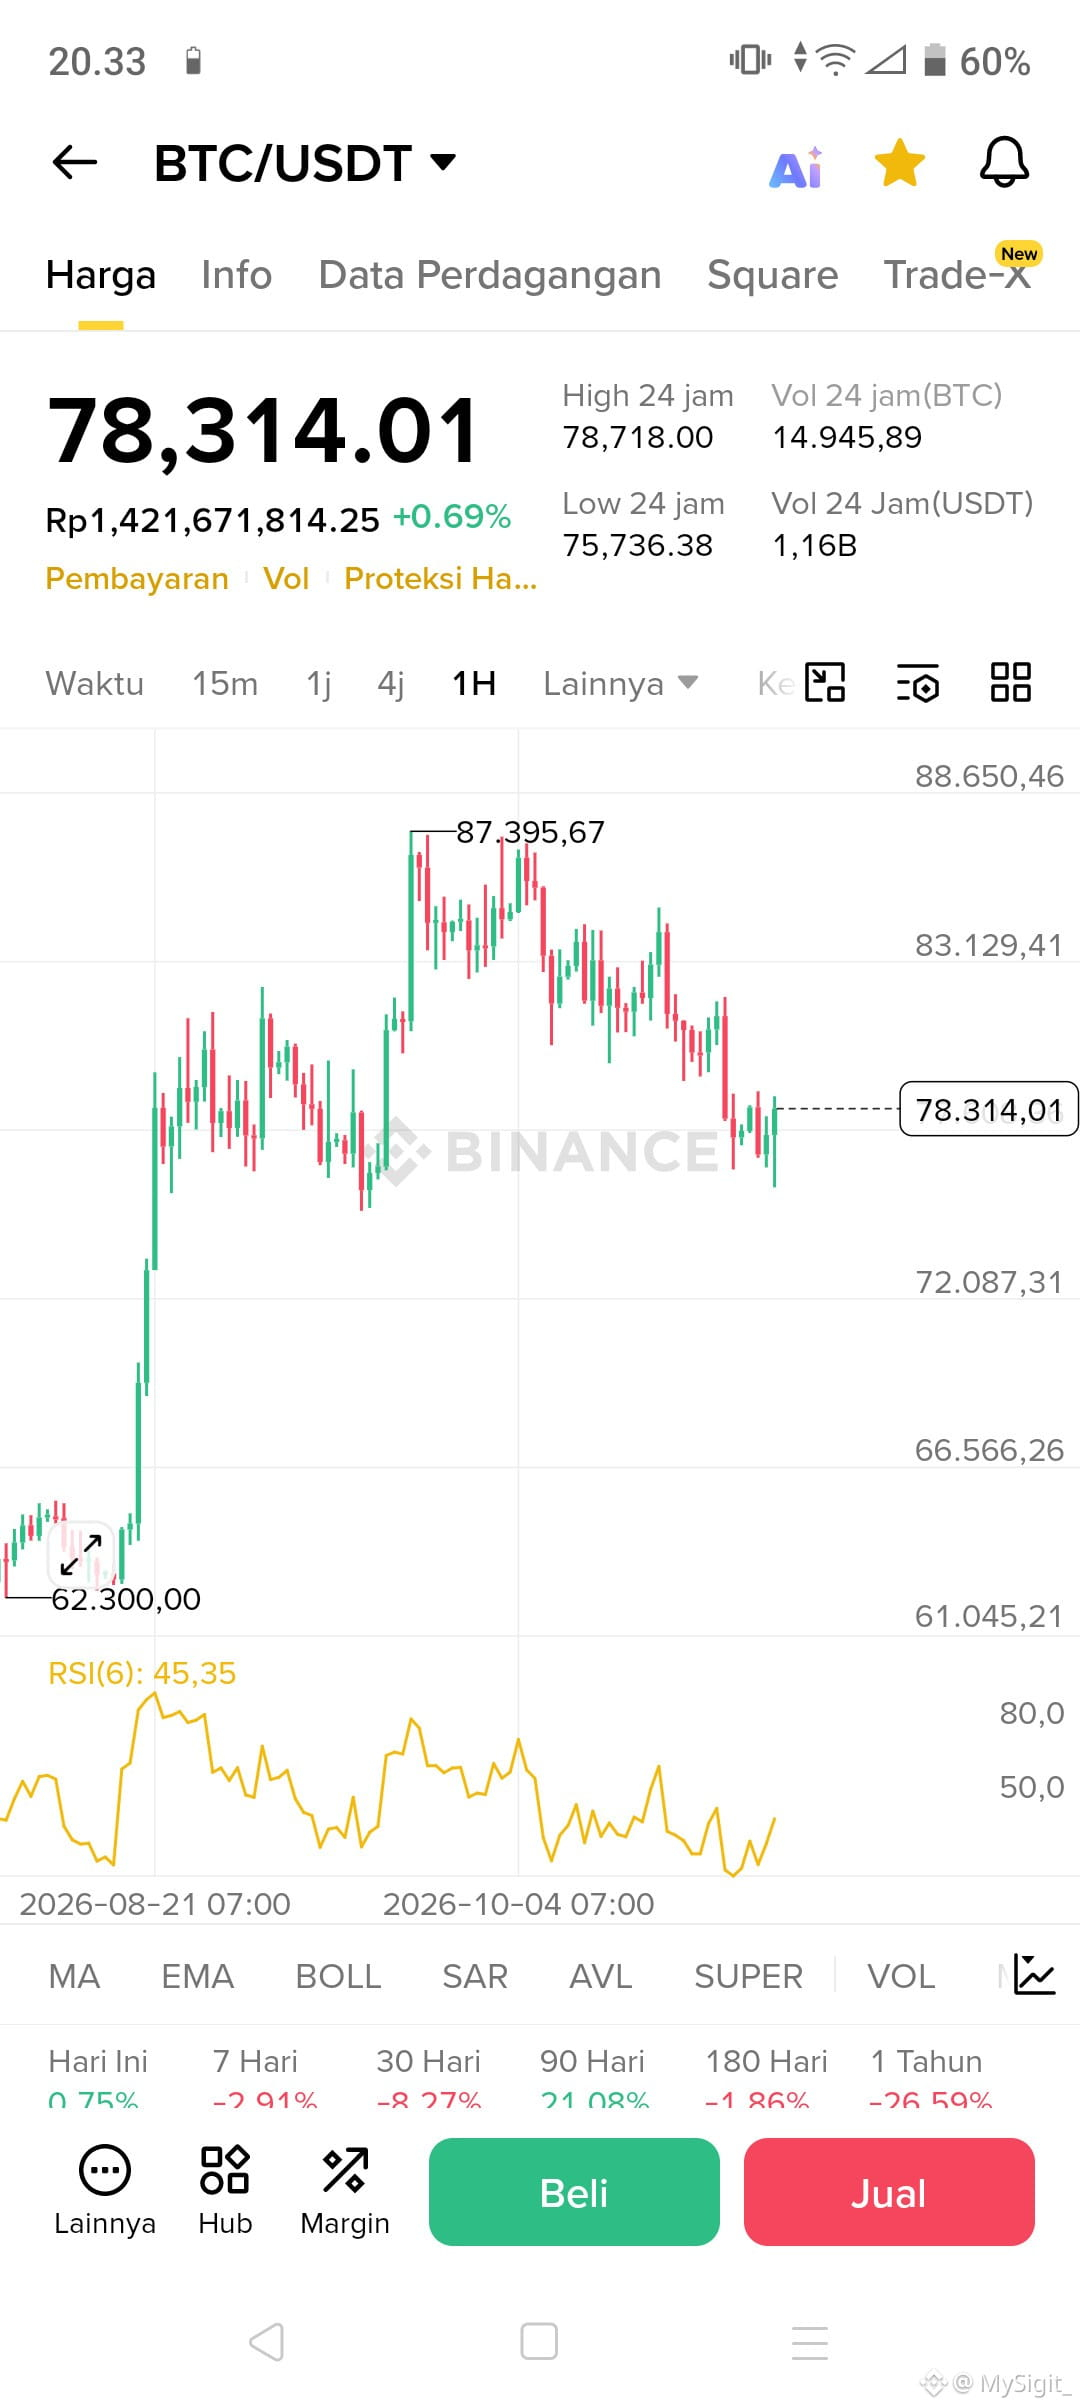
BTC outlook based on the 1H chart.
1. BTC / USDT - Now $78.314
BTC is currently at the upper edge of the range. It has tried to break through the ceiling 3 times, but hasn’t succeeded.
Bullish Scenario (Most likely, around 65%)
BTC’s 1H RSI is currently 46,29. That’s neutral to bullish. It’s neither overbought nor oversold. There’s still momentum.
If the 1H candle closes above $78.718:
- Target 1: $82.364
- Target 2: $83.129
- Target 3: $87.395 -> yesterday’s high, which BTC needs to reclaim
Why is the bullish scenario more likely? Because from 19.06 to 20.25 earlier, BTC’s lows kept rising: $78.088 -> $78.284 -> $78.298 -> $78.409 -> $78.484. That’s called a higher low. Buyers keep stepping in at higher prices.
Bearish Scenario (35% chance)
If BTC fails to break above $78.718 and instead drops below $75.853:
- Downside target 1: $75.736 -> yesterday’s low
- Downside target 2: $72.087
- Downside target 3: $69.342
As long as $75.853 hasn’t been broken, this bearish scenario isn’t valid yet. So don’t panic just yet.
BTC Summary:
BTC is building momentum around $78.400 to break above $78.718. If it breaks through tonight or tomorrow morning, the next target is $82.364.
#BTC #USMidterms-WhatAreMarketsExpecting?
1. BTC / USDT - Now $78.314
BTC is currently at the upper edge of the range. It has tried to break through the ceiling 3 times, but hasn’t succeeded.
Bullish Scenario (Most likely, around 65%)
BTC’s 1H RSI is currently 46,29. That’s neutral to bullish. It’s neither overbought nor oversold. There’s still momentum.
If the 1H candle closes above $78.718:
- Target 1: $82.364
- Target 2: $83.129
- Target 3: $87.395 -> yesterday’s high, which BTC needs to reclaim
Why is the bullish scenario more likely? Because from 19.06 to 20.25 earlier, BTC’s lows kept rising: $78.088 -> $78.284 -> $78.298 -> $78.409 -> $78.484. That’s called a higher low. Buyers keep stepping in at higher prices.
Bearish Scenario (35% chance)
If BTC fails to break above $78.718 and instead drops below $75.853:
- Downside target 1: $75.736 -> yesterday’s low
- Downside target 2: $72.087
- Downside target 3: $69.342
As long as $75.853 hasn’t been broken, this bearish scenario isn’t valid yet. So don’t panic just yet.
BTC Summary:
BTC is building momentum around $78.400 to break above $78.718. If it breaks through tonight or tomorrow morning, the next target is $82.364.
#BTC #USMidterms-WhatAreMarketsExpecting?