$KSTR / $ZAMA / $XPD 4-hour confluence turns bullish; bullish signals appear simultaneously🔥
════════════════════
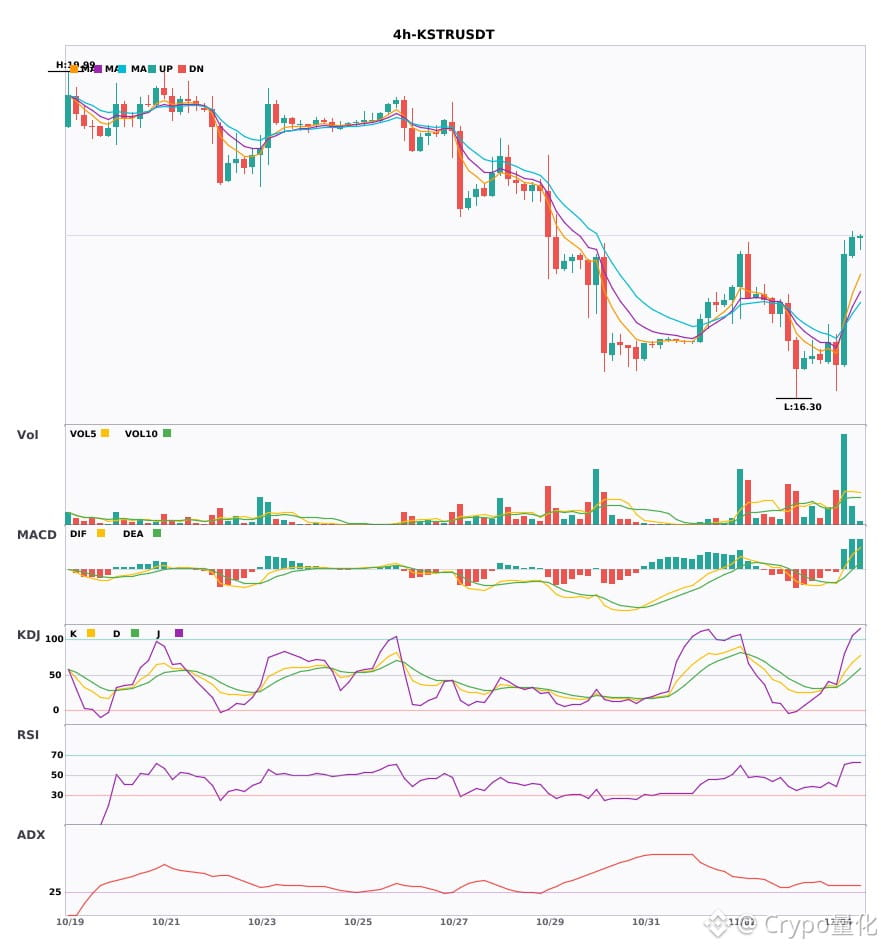
🔴 $KSTR 4-hour bullish signal
⚠️Technical analysis: ADX(34) indicates a clear trending market | MACD golden cross above zero, bullish momentum released | EMA5 crosses above EMA8, short-term outlook turns bullish | Volume surge (3.5x)
════════════════════
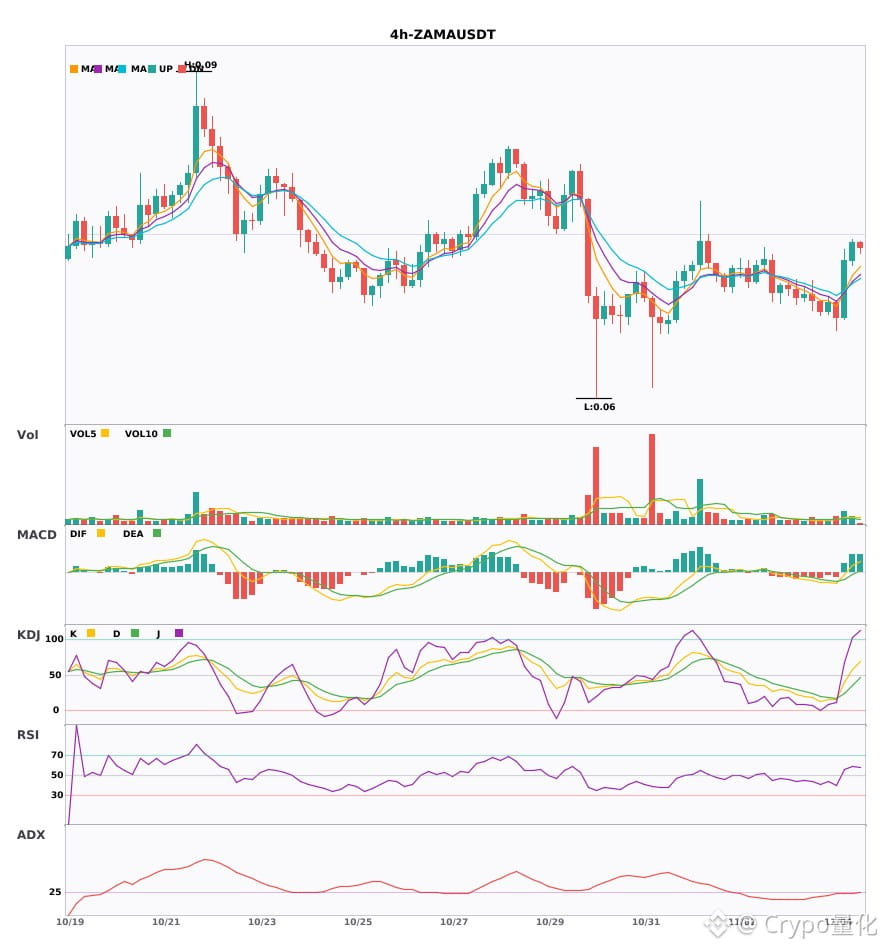
🔴 $ZAMA 4-hour bullish signal
⚠️Technical analysis: ADX(28) trend is forming, potential entry | MACD DIF breaks above the zero line, trend turns bullish | EMA5 > EMA8 > EMA13, bullish alignment | Volume increases (2.1x)
════════════════════
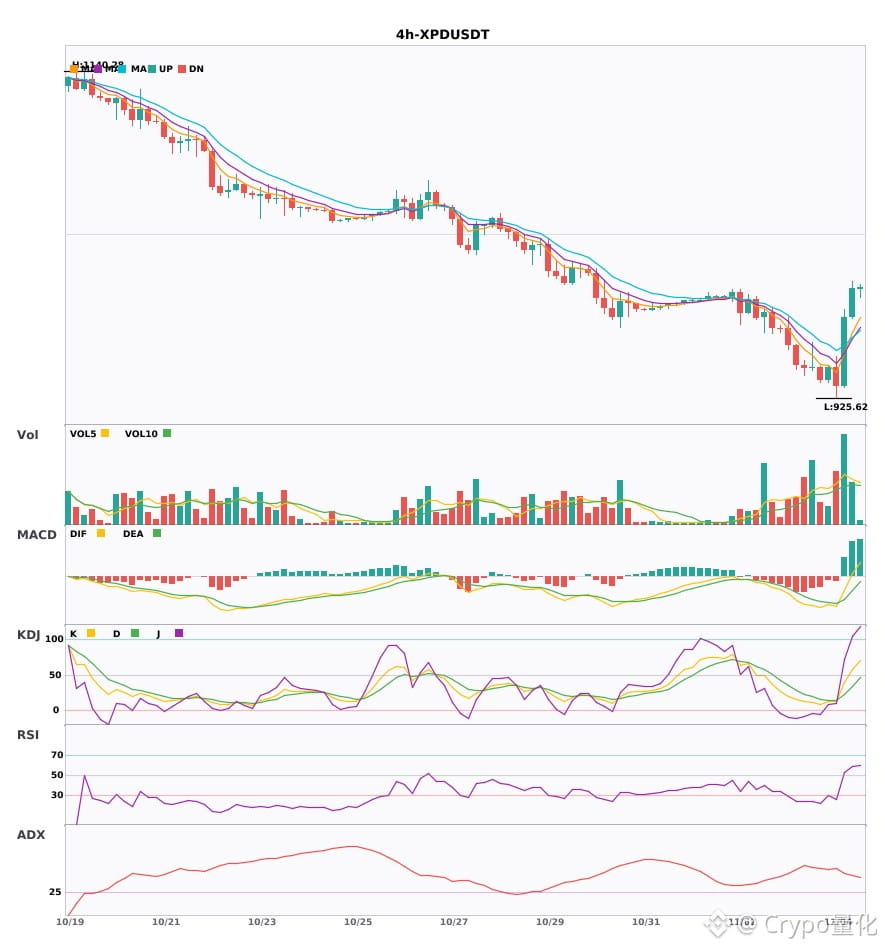
🔴 $XPD 4-hour bullish signal
⚠️Technical analysis: ADX(45) indicates a clear trending market | MACD DIF breaks above the zero line, trend turns bullish | EMA5 crosses above EMA8, short-term outlook turns bullish | Volume increases (2.4x)
════════════════════
🔔 Follow for the latest market movements 🔔
#技术分析 #KSTR #ZAMA #XPD
📌 When trading, pay attention to whether the candlestick pattern confirms the signal
════════════════════
🔴 $KSTR 4-hour bullish signal
⚠️Technical analysis: ADX(34) indicates a clear trending market | MACD golden cross above zero, bullish momentum released | EMA5 crosses above EMA8, short-term outlook turns bullish | Volume surge (3.5x)
════════════════════
🔴 $ZAMA 4-hour bullish signal
⚠️Technical analysis: ADX(28) trend is forming, potential entry | MACD DIF breaks above the zero line, trend turns bullish | EMA5 > EMA8 > EMA13, bullish alignment | Volume increases (2.1x)
════════════════════
🔴 $XPD 4-hour bullish signal
⚠️Technical analysis: ADX(45) indicates a clear trending market | MACD DIF breaks above the zero line, trend turns bullish | EMA5 crosses above EMA8, short-term outlook turns bullish | Volume increases (2.4x)
════════════════════
🔔 Follow for the latest market movements 🔔
#技术分析 #KSTR #ZAMA #XPD
📌 When trading, pay attention to whether the candlestick pattern confirms the signal