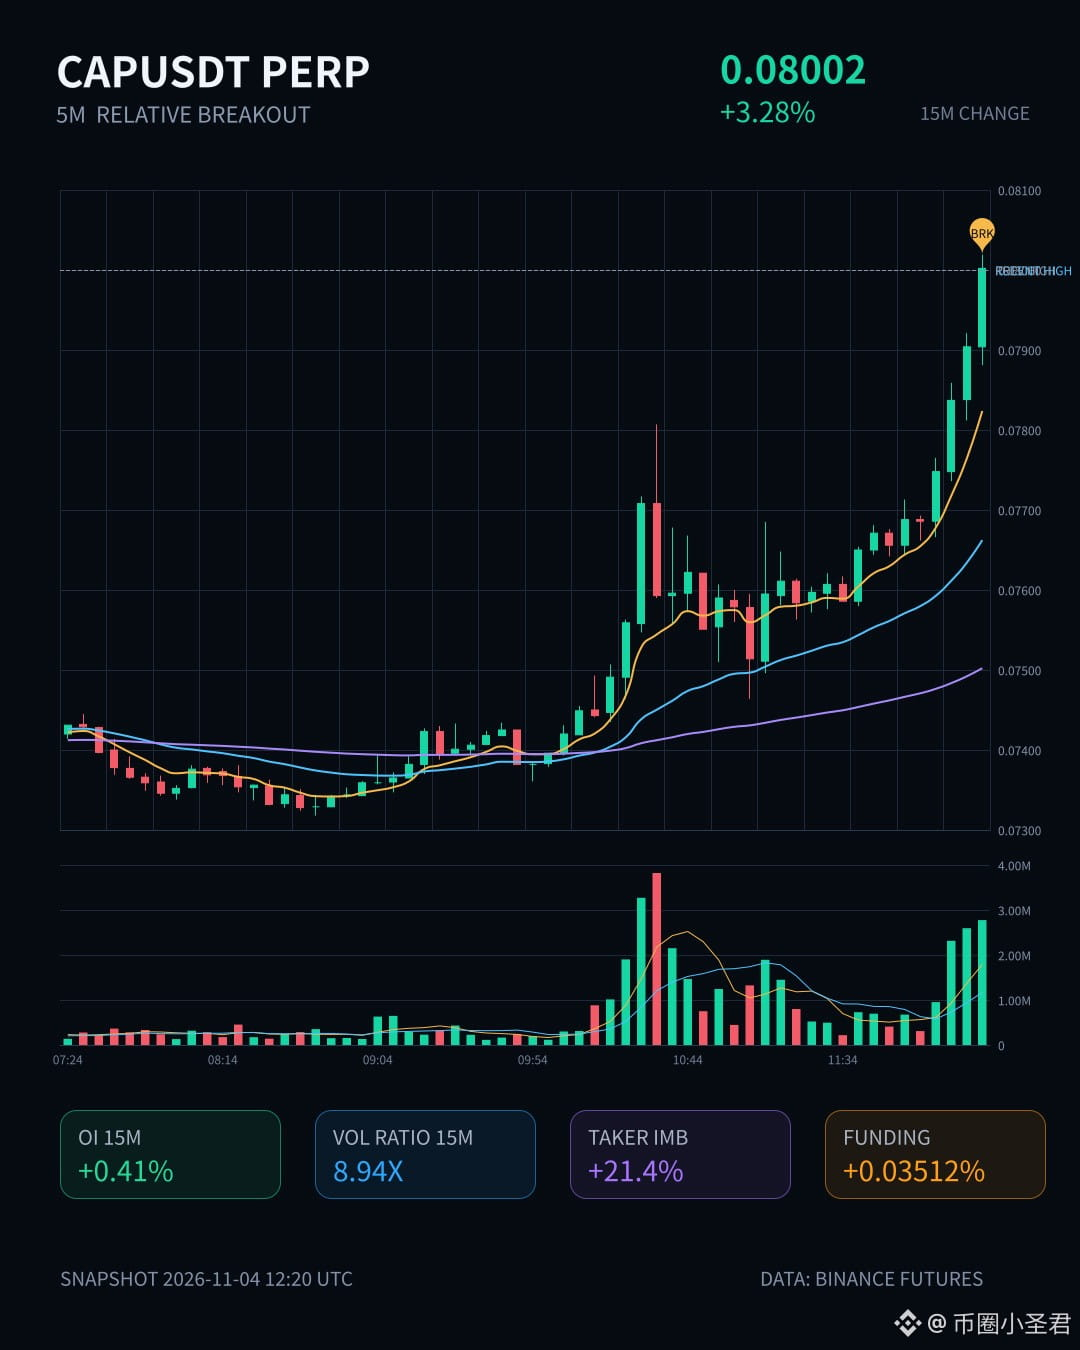
$CAP This move has some real substance. It surged 3.28% in 15m, with volume hitting 8.94x and a Z-score of 4.54—this is no ordinary blip.
The key is that OI moved along with it: +0.41% in 15m and +0.75% in 1h, with the combined notional change topping one million U. The anomaly percentile is 99.6%, ranking #3 across the entire pool. Price and open interest both rose—a classic sign of new leveraged longs entering, not a hollow pump caused by short squeezes.
On the chart, the closing price has already broken above the highs of the last 20 5m candles. Taker volume imbalance is 21.4%, and the buy/sell ratio is 1.55, showing clear buying strength. However, 24h trading volume is only 8.45M, so liquidity is not particularly deep. Be cautious about chasing at this level, and watch out for slippage and fake breakouts.
Several consecutive periods of follow-through and depth confirmation are now in place. First, see whether price can hold above the top of this range—if it can't, this could turn into nothing more than a wick.
The key is that OI moved along with it: +0.41% in 15m and +0.75% in 1h, with the combined notional change topping one million U. The anomaly percentile is 99.6%, ranking #3 across the entire pool. Price and open interest both rose—a classic sign of new leveraged longs entering, not a hollow pump caused by short squeezes.
On the chart, the closing price has already broken above the highs of the last 20 5m candles. Taker volume imbalance is 21.4%, and the buy/sell ratio is 1.55, showing clear buying strength. However, 24h trading volume is only 8.45M, so liquidity is not particularly deep. Be cautious about chasing at this level, and watch out for slippage and fake breakouts.
Several consecutive periods of follow-through and depth confirmation are now in place. First, see whether price can hold above the top of this range—if it can't, this could turn into nothing more than a wick.