$XAU $XAUG.ETF
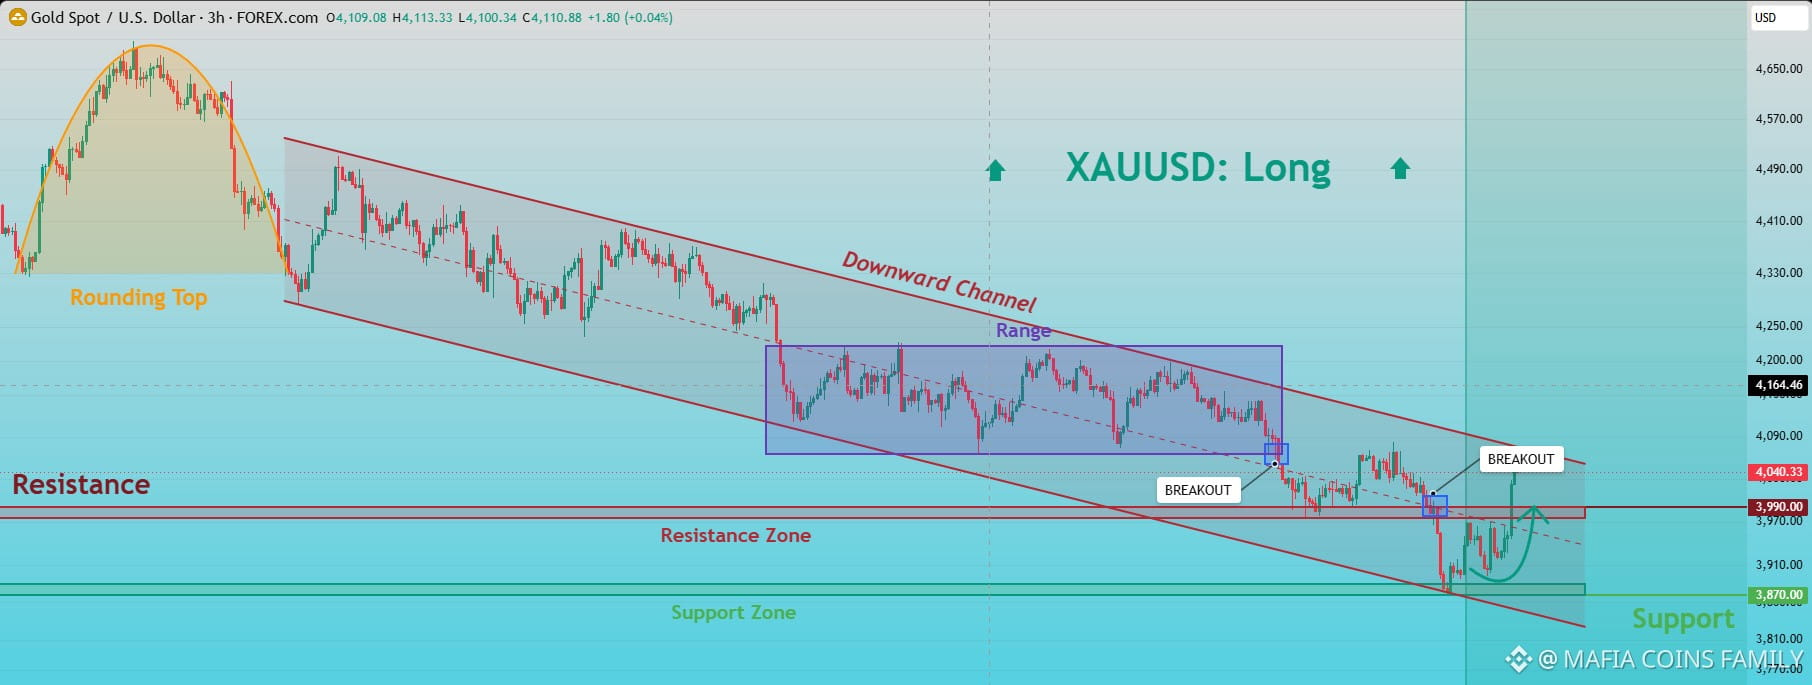
The XAU/USD (Gold) 3-hour chart shows a bullish recovery after a prolonged downward channel.
Previous trend: Gold formed a rounding top and then moved in a descending channel.
Consolidation: Price traded sideways within a range before breaking down.
Key resistance: 3,970–3,990, marked as a major resistance zone.
Support zone: 3,870–3,880, where buyers stepped in.
Current price action: Gold has bounced strongly from support and broken above the resistance area near 4,040.$XAU
The XAU/USD (Gold) 3-hour chart shows a bullish recovery after a prolonged downward channel.
Previous trend: Gold formed a rounding top and then moved in a descending channel.
Consolidation: Price traded sideways within a range before breaking down.
Key resistance: 3,970–3,990, marked as a major resistance zone.
Support zone: 3,870–3,880, where buyers stepped in.
Current price action: Gold has bounced strongly from support and broken above the resistance area near 4,040.$XAU