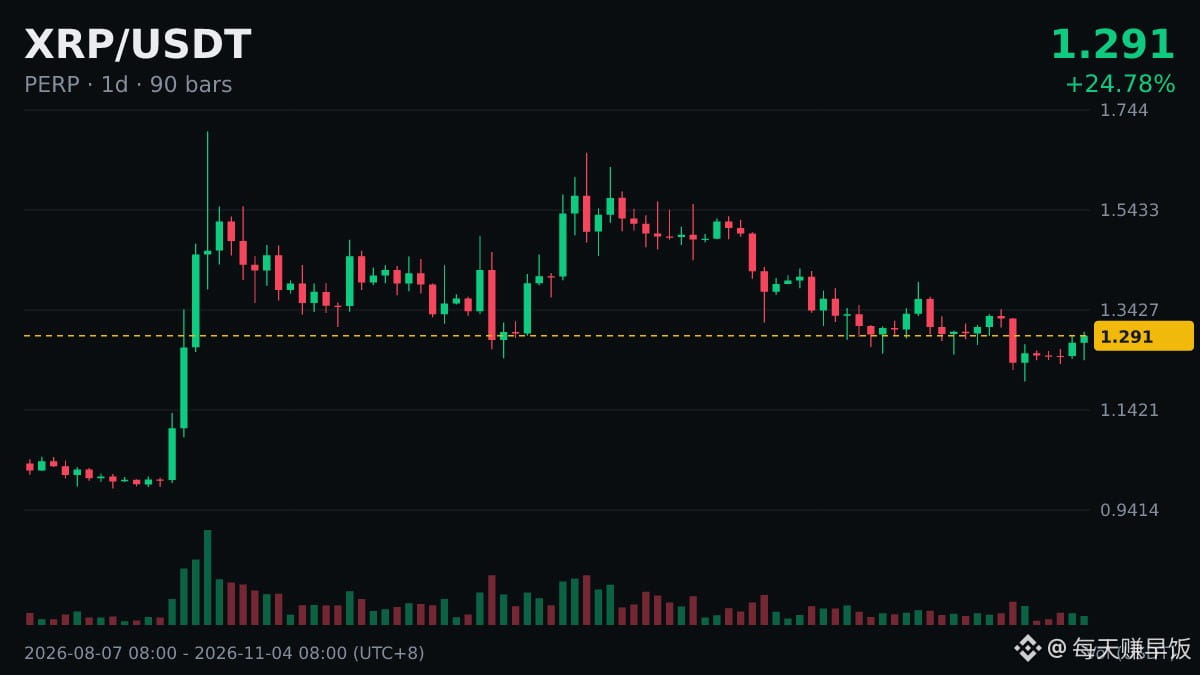
Jokester on deck to explain: $XRP daily MACD forms a golden cross below the zero line.
Whenever DIF and DEA cross, my hands start itching to trade—but luckily, I checked the definition first.
For a proper explanation, the height of the histogram bars reflects the distance between DIF and DEA. If each bar gets taller than the last, momentum in the current direction is building; if they get shorter, it’s fading.
The point of understanding an indicator is to avoid being spooked by a single number, not to use it to pinpoint tops and bottoms.
Whenever DIF and DEA cross, my hands start itching to trade—but luckily, I checked the definition first.
For a proper explanation, the height of the histogram bars reflects the distance between DIF and DEA. If each bar gets taller than the last, momentum in the current direction is building; if they get shorter, it’s fading.
The point of understanding an indicator is to avoid being spooked by a single number, not to use it to pinpoint tops and bottoms.