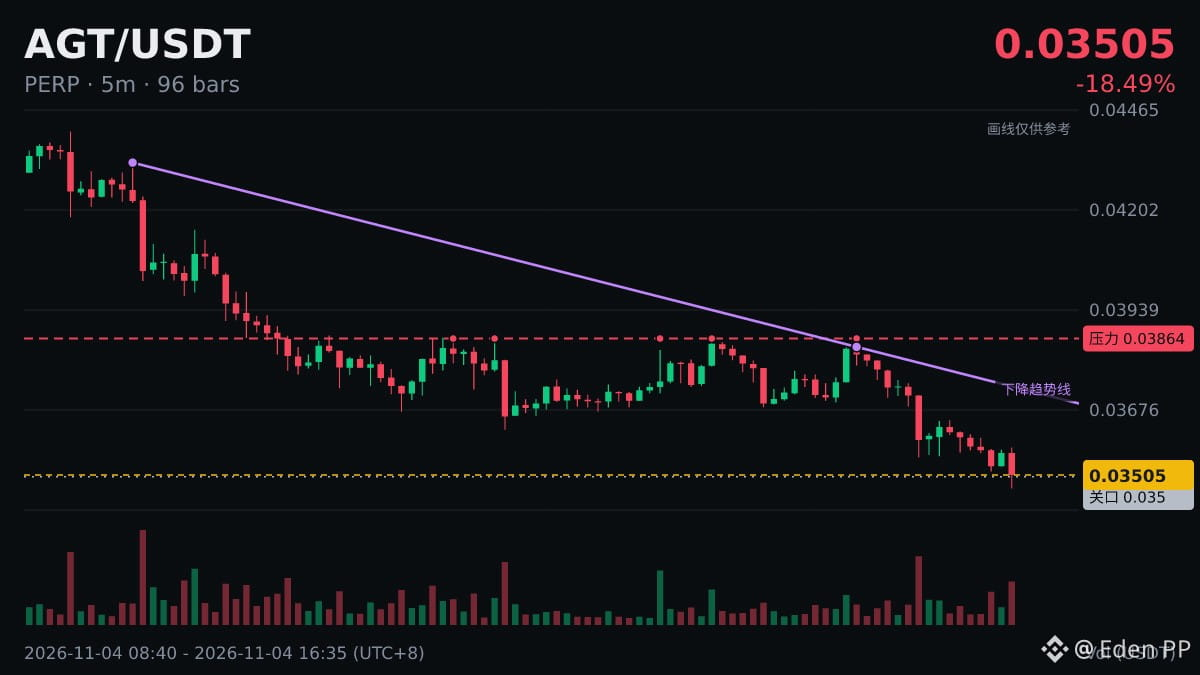
$AGT 1 hours, one huge bearish candle plunged 6.51%. The candlestick chart is doing an ECG again.
Current price: 0.03508, 1h -5.8%, 24h +5.89%.
The candlestick chart is doing an ECG again—of the low-blood-sugar kind.
Stay calm and figure out your exit plan first.
Current price: 0.03508, 1h -5.8%, 24h +5.89%.
The candlestick chart is doing an ECG again—of the low-blood-sugar kind.
Stay calm and figure out your exit plan first.