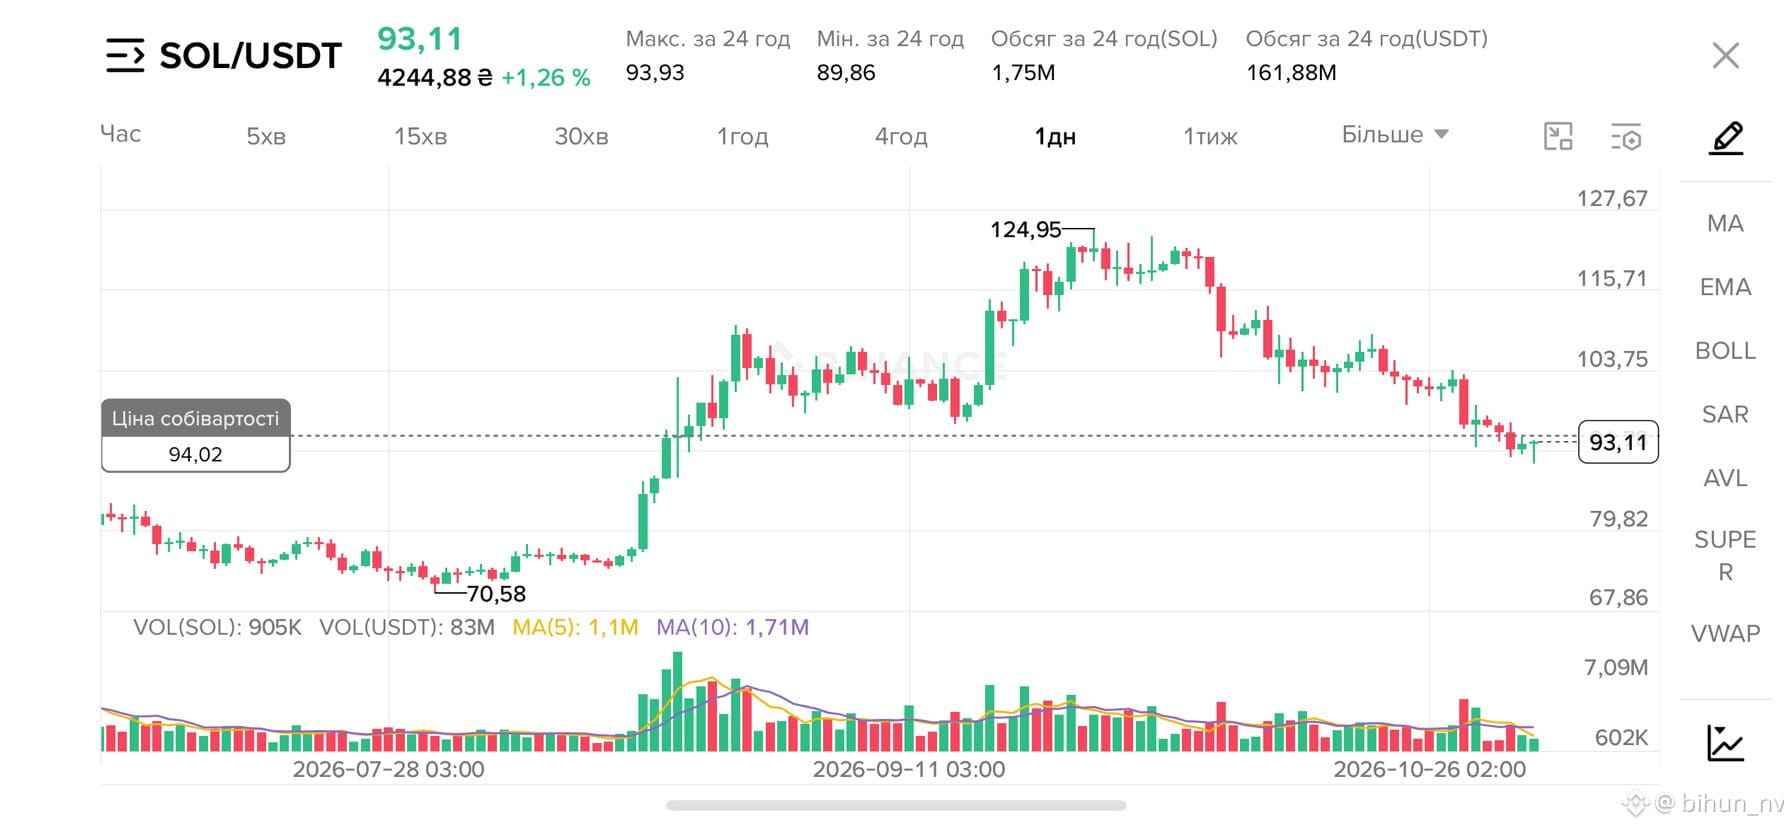
$SOL Current momentum: According to the latest data, the price of
SOL on the 1-hour chart has recovered to $93,10 after falling to $89,86. Short-term momentum
is positive: EMA 7 ($92,61) crossed EMA 25
($92,72) upward.
• Oscillators: MACD shows a bullish crossover (the histogram rose to +0,025), while RSI 14 at ~54,66 confirms buyer dominance without being overbought.
Support and resistance levels
• Support: The $92,72 level (EMA 25 together with the middle Bollinger Band at $92,92) serves as the nearest stabilization zone. The key liquidity base has formed around the local low of
$89,86.
• Resistance: The main obstacle remains the
long-term EMA 99 ($94,16) and the upper Bollinger
Band ($94,51).
Key trading levels
• Potential entry (Buy): 92.70 (test of EMA 25 and the Bollinger Band support).
• Profit-taking target (Sell): 94.20 (taking profit near the declining EMA 99).
SOL on the 1-hour chart has recovered to $93,10 after falling to $89,86. Short-term momentum
is positive: EMA 7 ($92,61) crossed EMA 25
($92,72) upward.
• Oscillators: MACD shows a bullish crossover (the histogram rose to +0,025), while RSI 14 at ~54,66 confirms buyer dominance without being overbought.
Support and resistance levels
• Support: The $92,72 level (EMA 25 together with the middle Bollinger Band at $92,92) serves as the nearest stabilization zone. The key liquidity base has formed around the local low of
$89,86.
• Resistance: The main obstacle remains the
long-term EMA 99 ($94,16) and the upper Bollinger
Band ($94,51).
Key trading levels
• Potential entry (Buy): 92.70 (test of EMA 25 and the Bollinger Band support).
• Profit-taking target (Sell): 94.20 (taking profit near the declining EMA 99).