BTCUSDT | How the Market Played Out Exactly as Mapped 🎯
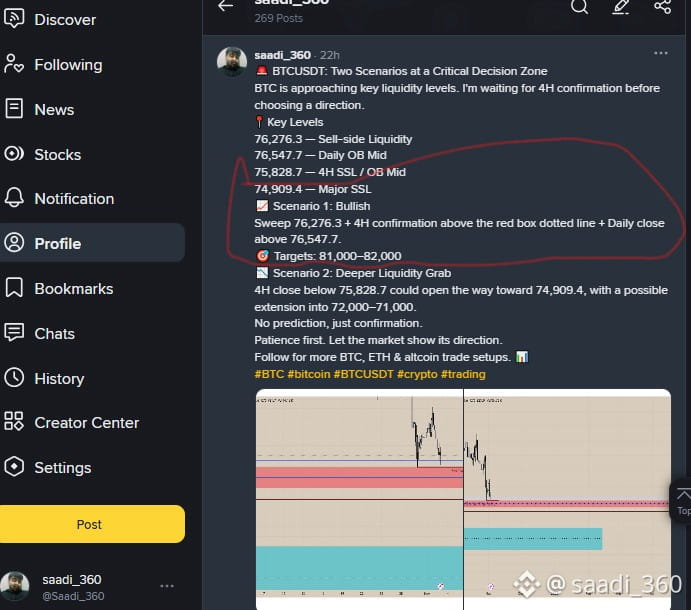
Yesterday, I shared two clear scenarios at a critical BTC decision zone. Here’s how the bullish scenario played out.
1️⃣ Bullish Scenario: Conditions for a Long
My conditions were:
Sweep of major sell-side liquidity at 76,270
4H confirmation above the red box dotted line
Daily close above 76,547.7
These were the conditions I wanted before considering a long entry.
2️⃣ What Actually Happened?
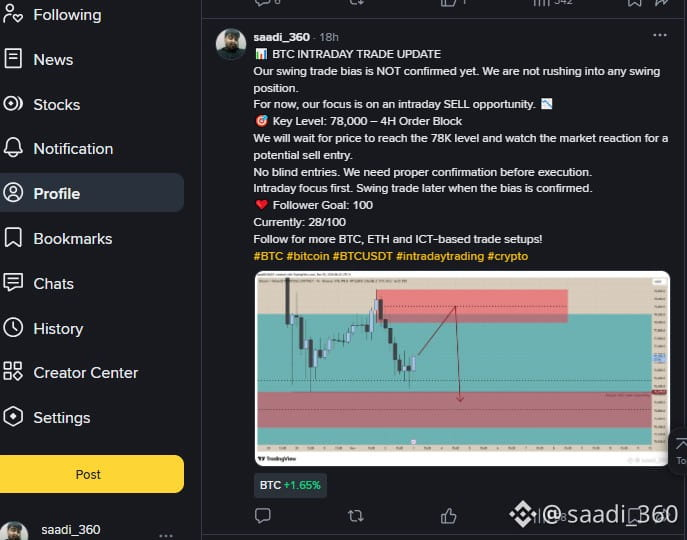
BTC dropped from the 78K area, targeted lower liquidity at 76,270, and did not close a candle body below the middle dotted line of the red box.
That was the key reaction I was watching for. After the level was respected, price delivered a strong impulsive move higher.
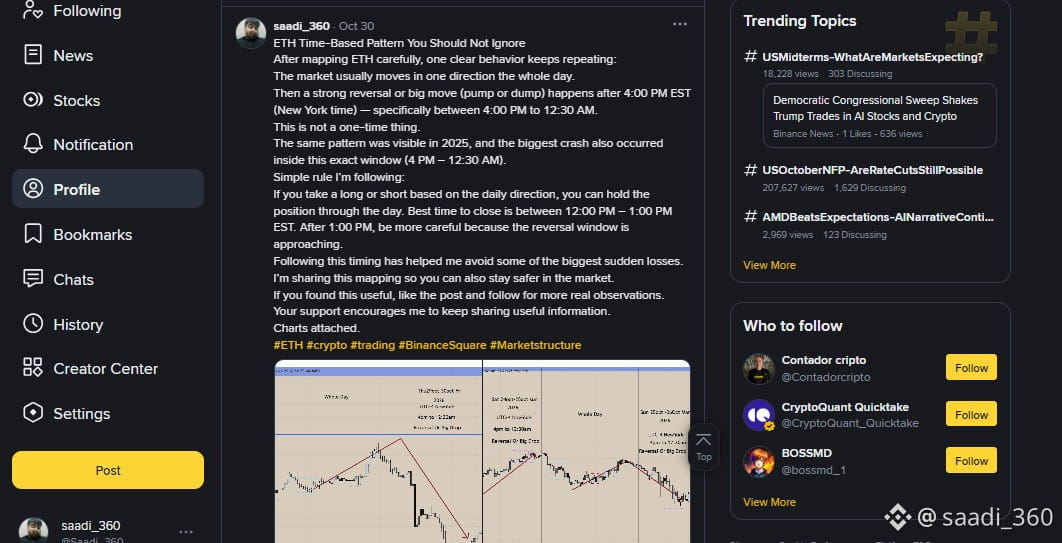
3️⃣ The Time-Based Observation
On 30 October, I highlighted that BTC had often shown meaningful expansion after 4 PM EST, either upward or downward.
The same behavior appeared again. After 4 PM EST, BTC expanded lower first, taking liquidity at 76,270, before the bullish reaction developed.
This is a market observation, not a guaranteed rule or prediction.
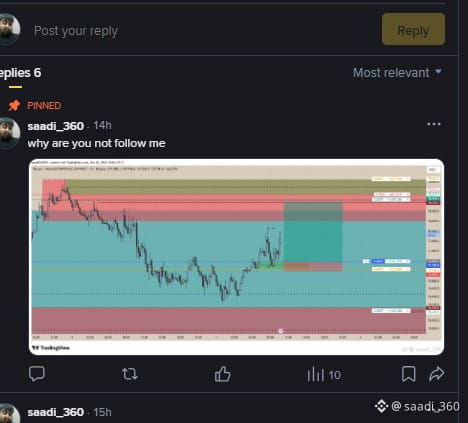
4️⃣ The Long Setup I Shared
Entry: 77,196.3
Stop Loss: 77,022
Take Profit: 78,377
Planned Risk/Reward: 1:6.77
The setup reached its target, and I shared the result in the comments.
5️⃣ The Main Lesson
No blind entries. I wait for the liquidity grab, the 4H body confirmation, and the market's reaction before looking for an entry.
Liquidity first. Confirmation next. Execution after.
Patience > Prediction.
🚀 ROAD TO 100 FOLLOWERS!
I'm currently at 29 followers — just 71 more to go! ❤️
If you find my BTC analysis and ICT / Smart Money Concepts useful, please follow me for more structured BTC, ETH & altcoin market analysis and trade setups.
Your support means a lot. Let's reach 100 together! 🎯
#BTC #bitcoin #BTCUSDT #TradingSignals #ict
Yesterday, I shared two clear scenarios at a critical BTC decision zone. Here’s how the bullish scenario played out.
1️⃣ Bullish Scenario: Conditions for a Long
My conditions were:
Sweep of major sell-side liquidity at 76,270
4H confirmation above the red box dotted line
Daily close above 76,547.7
These were the conditions I wanted before considering a long entry.
2️⃣ What Actually Happened?
BTC dropped from the 78K area, targeted lower liquidity at 76,270, and did not close a candle body below the middle dotted line of the red box.
That was the key reaction I was watching for. After the level was respected, price delivered a strong impulsive move higher.
3️⃣ The Time-Based Observation
On 30 October, I highlighted that BTC had often shown meaningful expansion after 4 PM EST, either upward or downward.
The same behavior appeared again. After 4 PM EST, BTC expanded lower first, taking liquidity at 76,270, before the bullish reaction developed.
This is a market observation, not a guaranteed rule or prediction.
4️⃣ The Long Setup I Shared
Entry: 77,196.3
Stop Loss: 77,022
Take Profit: 78,377
Planned Risk/Reward: 1:6.77
The setup reached its target, and I shared the result in the comments.
5️⃣ The Main Lesson
No blind entries. I wait for the liquidity grab, the 4H body confirmation, and the market's reaction before looking for an entry.
Liquidity first. Confirmation next. Execution after.
Patience > Prediction.
🚀 ROAD TO 100 FOLLOWERS!
I'm currently at 29 followers — just 71 more to go! ❤️
If you find my BTC analysis and ICT / Smart Money Concepts useful, please follow me for more structured BTC, ETH & altcoin market analysis and trade setups.
Your support means a lot. Let's reach 100 together! 🎯
#BTC #bitcoin #BTCUSDT #TradingSignals #ict