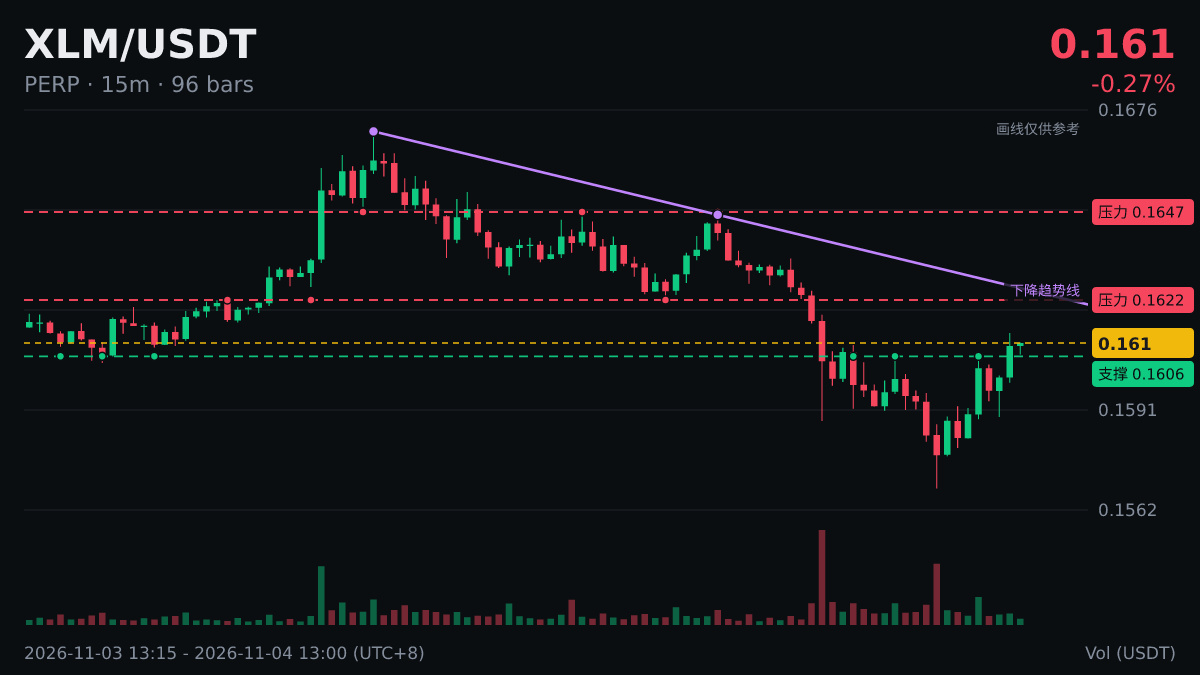
Data at a glance: $XLM | Breaking through the 0.16 level
What it is: There are often many stop-loss orders clustered around a key level. If the price breaks through it, those stops may be triggered all at once, often causing volatility to spike.
How to read it: It’s common for the price to break through a level and then fall back, so many people wait for the candle to close before treating the move as confirmed, rather than chasing it the moment it breaks through.
Don’t let a single indicator disrupt your original plan, and don’t use borrowed money to test a reading.
What it is: There are often many stop-loss orders clustered around a key level. If the price breaks through it, those stops may be triggered all at once, often causing volatility to spike.
How to read it: It’s common for the price to break through a level and then fall back, so many people wait for the candle to close before treating the move as confirmed, rather than chasing it the moment it breaks through.
Don’t let a single indicator disrupt your original plan, and don’t use borrowed money to test a reading.